Risk Overview
The Risk Overview page provides a comprehensive summary of vulnerabilities, offering a visual representation through multiple graphs that categorize vulnerabilities by:
- Device/ End Points
- Cloud Workloads
- Network Perimeter
These graphs also provide insights into:
- Vulnerability severity
- Total vulnerabilities discovered within the organization
- Top high-risk devices within the organization
This page enables users to quickly grasp the vulnerability landscape and prioritize remediation efforts.
Requirements
- The Risk Overview page results are only populated after at least one scan has been completed from any of the following dashboard:
- Device Risks
- Cloud Workload Risks
- Network Perimeter Risks
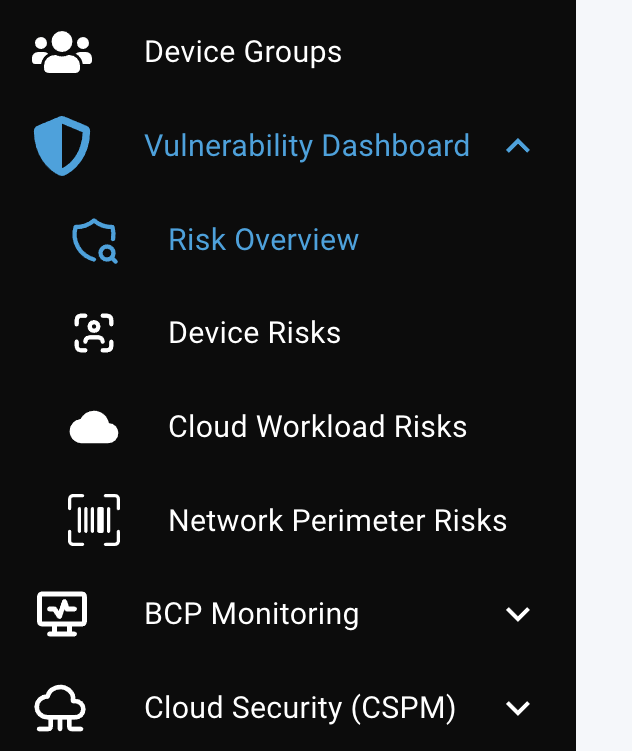
To view a reference image of identifying vulnerability dashboard from navigation bar, click here to expand.
Viewing Scan Results: Vulnerabilities Based On Type
The following are 3 types (categories) of vulnerabilities that can be found during security scan:
- Device (End Point) vulnerabilities: Device vulnerabilities refer to weaknesses identified through the
Device Risksdashboard. The TraQez Agent installed on endpoints collects information on installed software and OS details, which is then submitted to the TraQez Security scanner. The scanner performs a thorough vulnerability assessment and returns all identified vulnerabilities, displaying them in the Device Risks dashboard. - Cloud workload vulnerabilities: Cloud workload vulnerabilities refer to weaknesses identified through the
Cloud Workload Risksdashboard. These vulnerabilities are uncovered by our Agent-less TraQez Security scanner, which scans cloud environment workloads running in AWS, Azure, and GCP. Currently, our scanner supports Virtual Machine workloads. - Network Perimeter vulnerabilities: Network perimeter vulnerabilities refer to weaknesses identified through the Network Perimeter Risks dashboard. These vulnerabilities are uncovered by our Agent-less TraQez Security scanner, which scans public IP addresses within your network perimeter, including those assigned to firewalls, servers, and workstations.
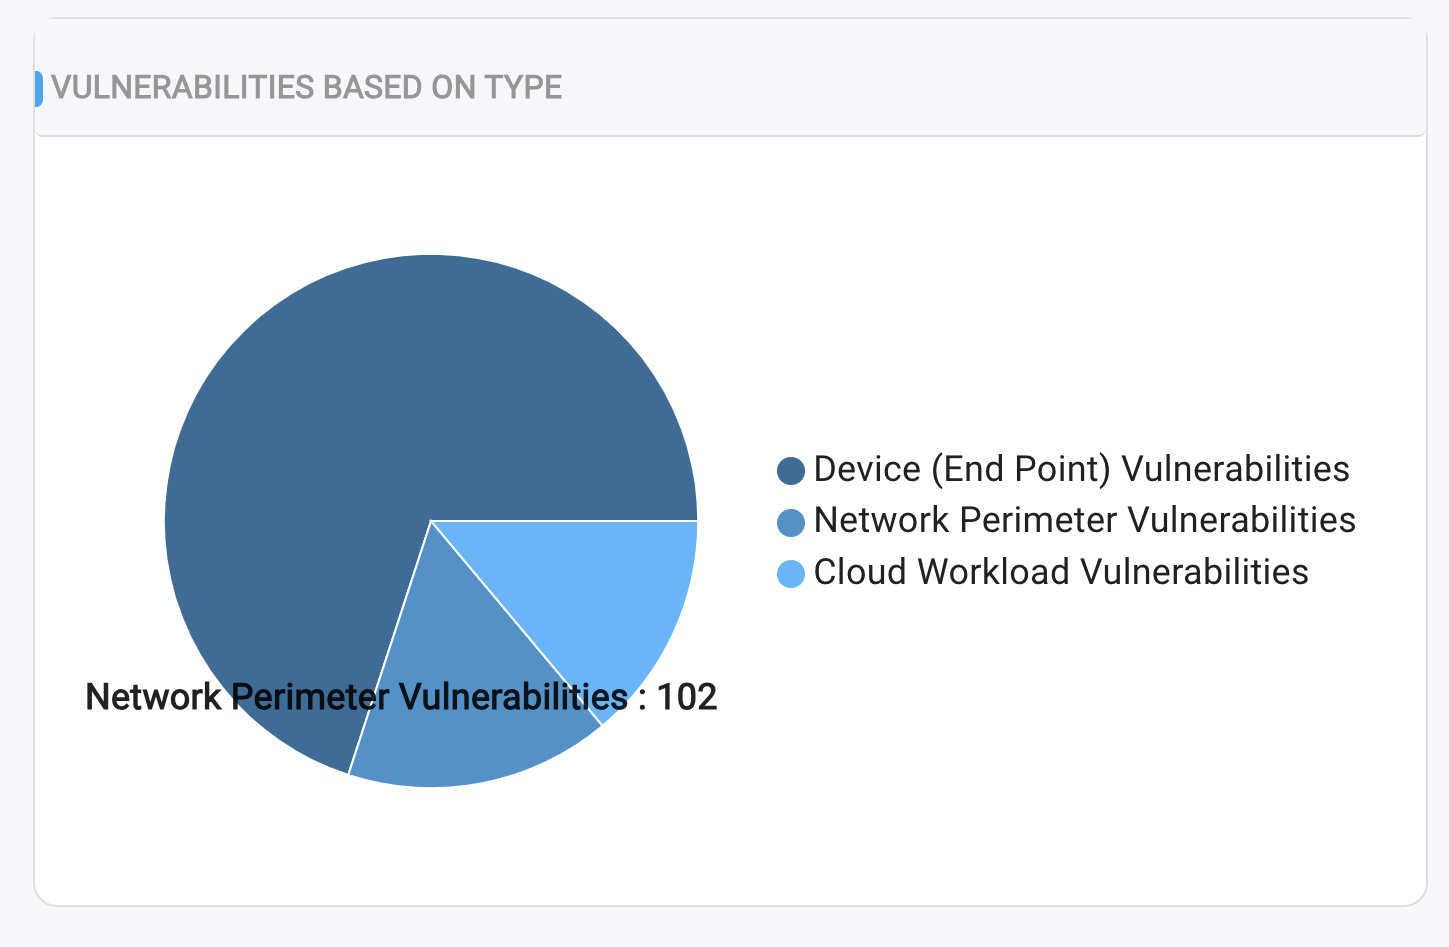
The Pie Chart in the "Vulnerabilities Based On Type" section displays the total unique number of vulnerabilities discovered across three key areas:
- Endpoints (Devices)
- Cloud Workloads
- Network Perimeter (Infrastructure)
This chart provides a visual representation of the distribution of unique vulnerabilities across these different environments.
To view a reference image of pi chart representing vulnerabilities count, click here to expand.
NOTE: In cases where a common vulnerability is identified across multiple types (Device/ End Points, Cloud workloads, and Network/Infrastructure), the count will be reflected in all three categories. This means that the same vulnerability may be counted multiple times if it affects multiple areas.
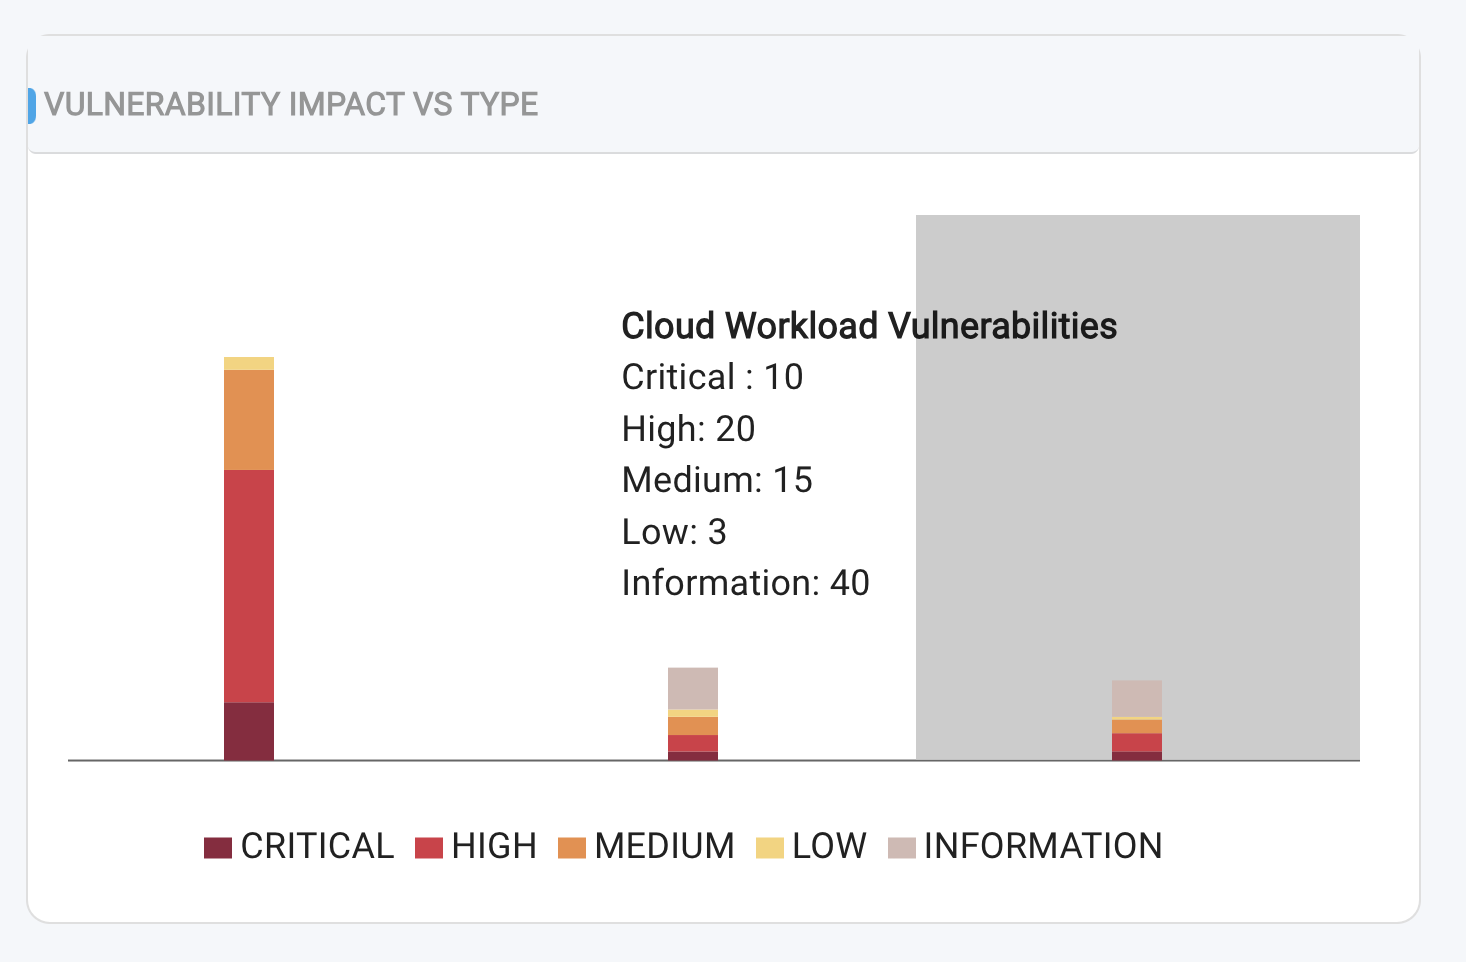
Viewing Scan Results: Vulnerability Impact Vs Type
The stacked bar graph illustrates the distribution of vulnerability counts by severity across three key areas:
- Devices (Endpoints)
- Cloud Workloads
- Network Perimeter (Infrastructure)
This graph provides a visual representation of the severity-wise breakdown of vulnerabilities across devices, cloud workloads, and network perimeter.
To view a reference image of stacked bar chart representing vulnerabilities count, click here to expand.
NOTE: In cases where a common vulnerability is identified across multiple types (Device, Cloud workload, and Network perimeter), it will be counted separately in each category based on its severity level. As a result, the same vulnerability may appear multiple times in the graph, reflecting its impact across different environments.
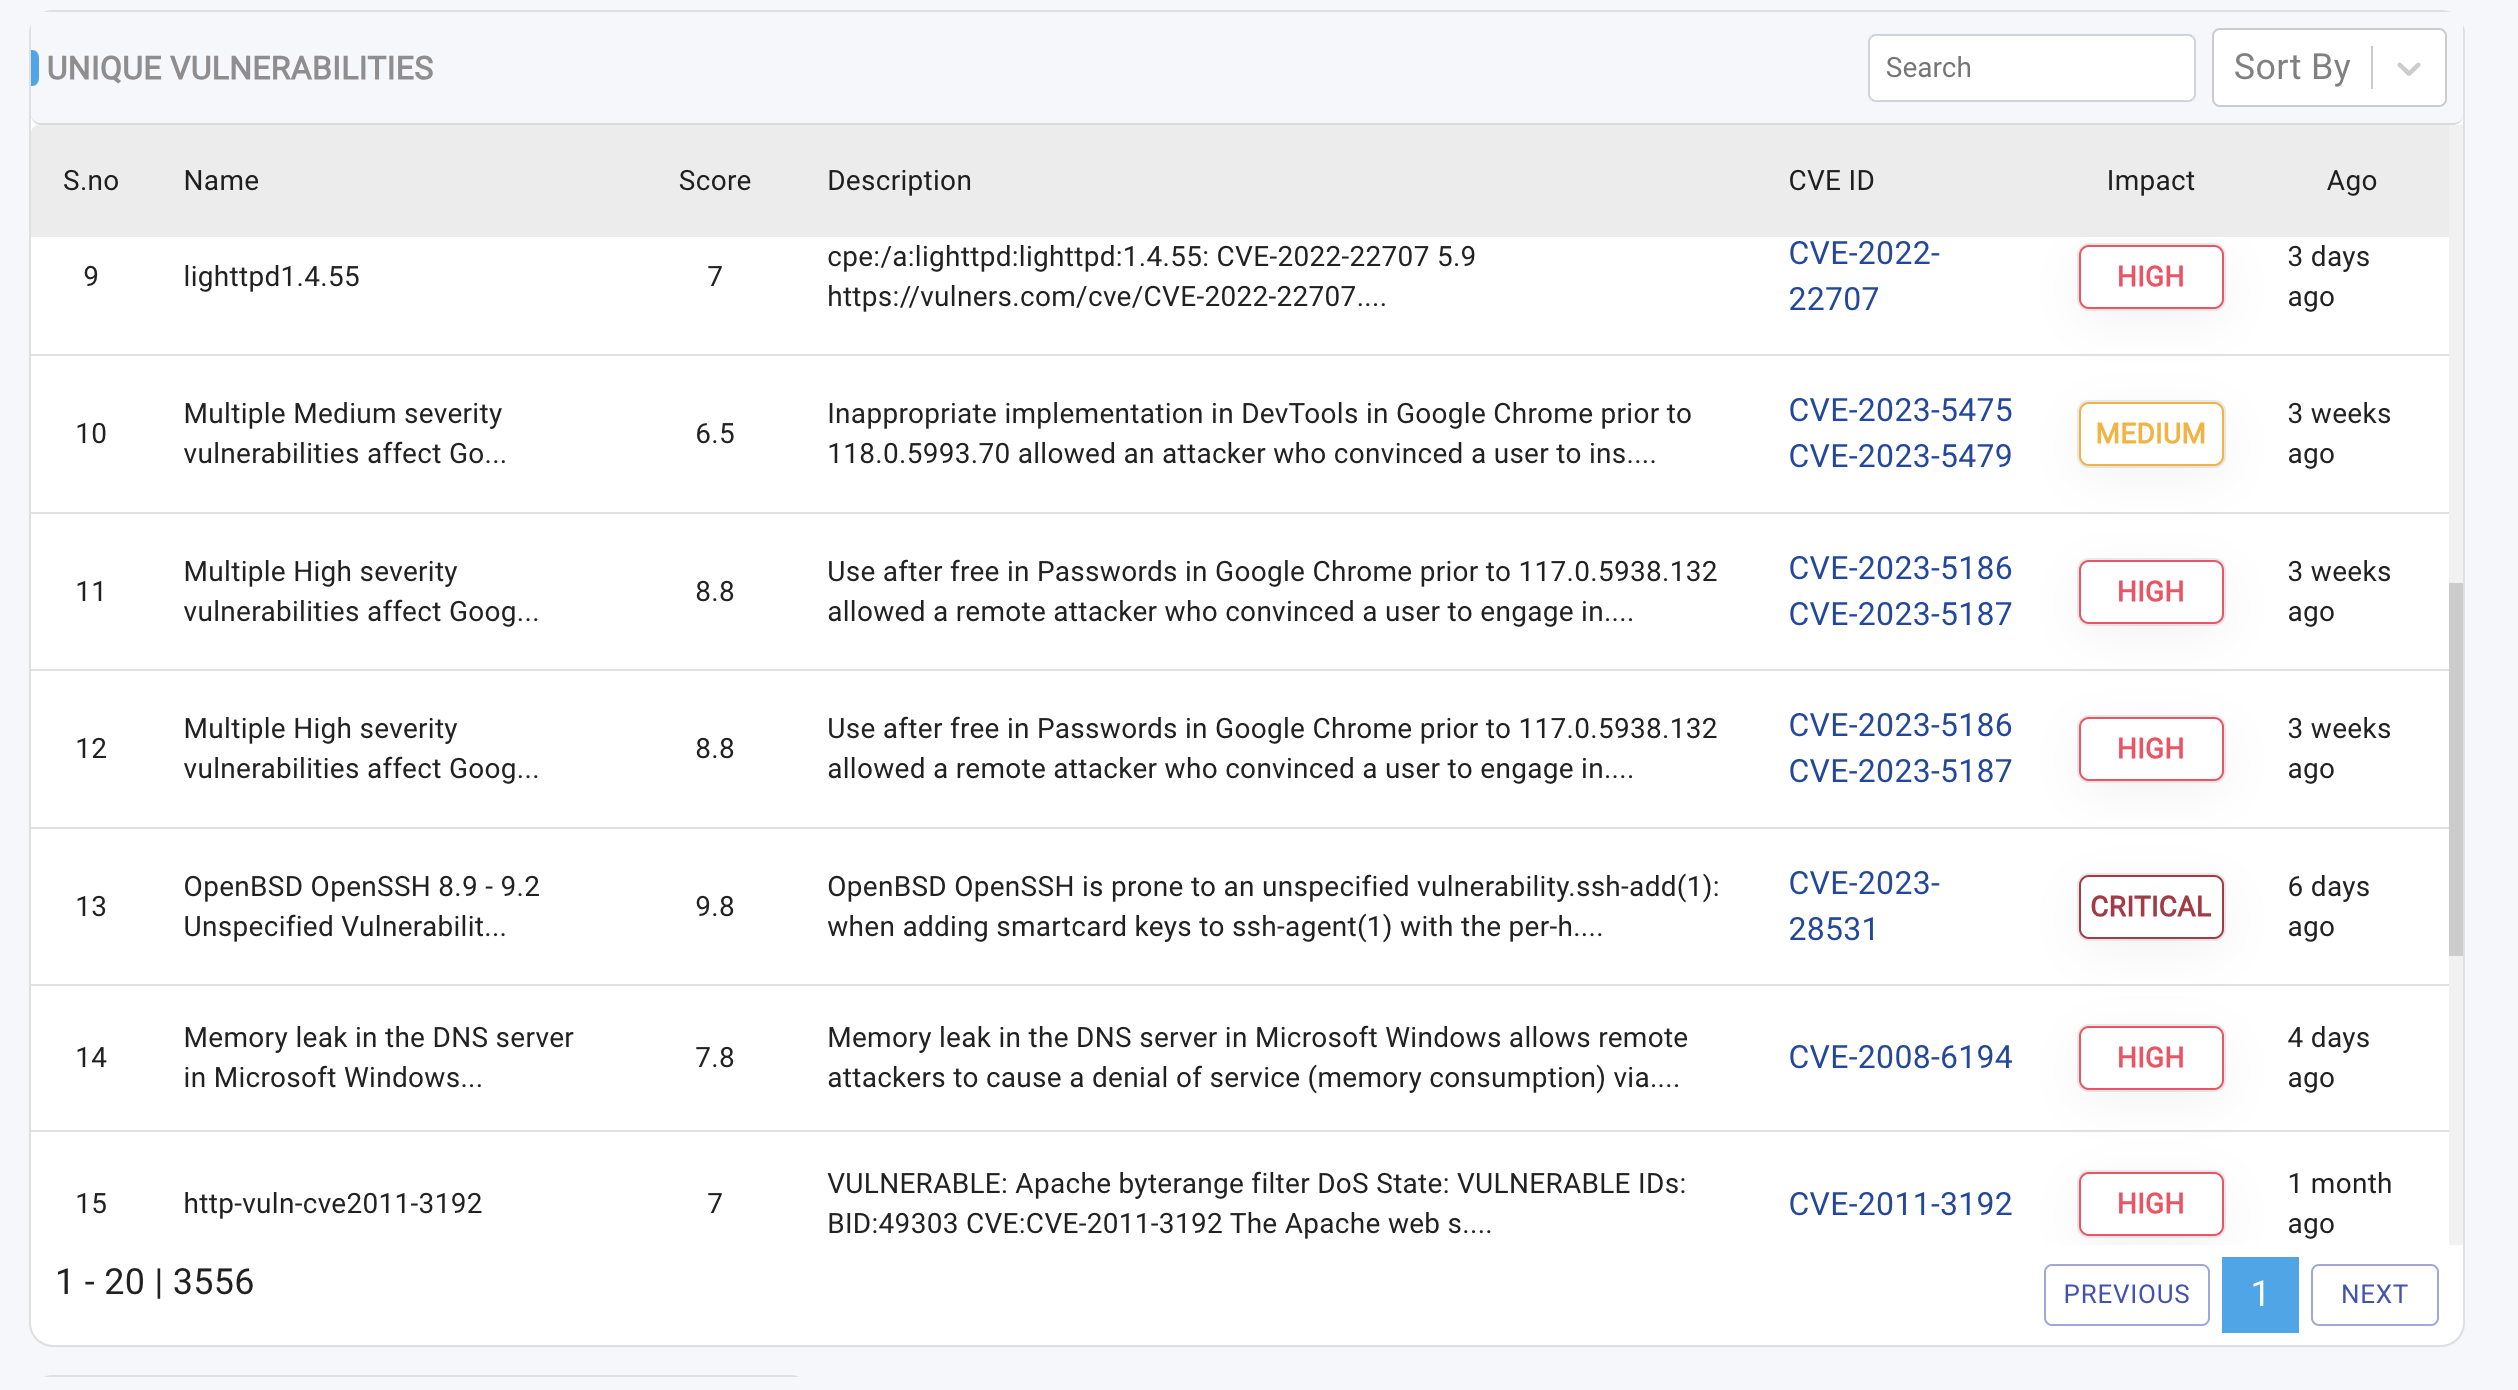
Viewing Scan Results: Unique Vulnerabilities
The Vulnerability Summary Table provides an overview of all unique vulnerabilities identified across three key areas:
- Devices (Endpoints)
- Cloud Workloads
- Network Perimeter (Infrastructure)
The table includes the following details for each vulnerability:
Name:The Name or title of the vulnerability.Score (severity rating):Between 0 to 10.Description:Description of vulnerability.CVE-ID(Common Vulnerabilities and Exposures identifier): This field displays a list of all CVE-IDs associated with a particular vulnerability.Impact(potential consequences of the vulnerability): Impact takes 5 values. Critical, High, Medium, Low and Informational.Date Uncovered:This field indicates when the vulnerability was initially detected, displayed as the time elapsed since its discovery (e.g., "30 minutes ago", "3 days ago", etc.).
To view a reference image of table representing unique vulnerabilities, click here to expand.
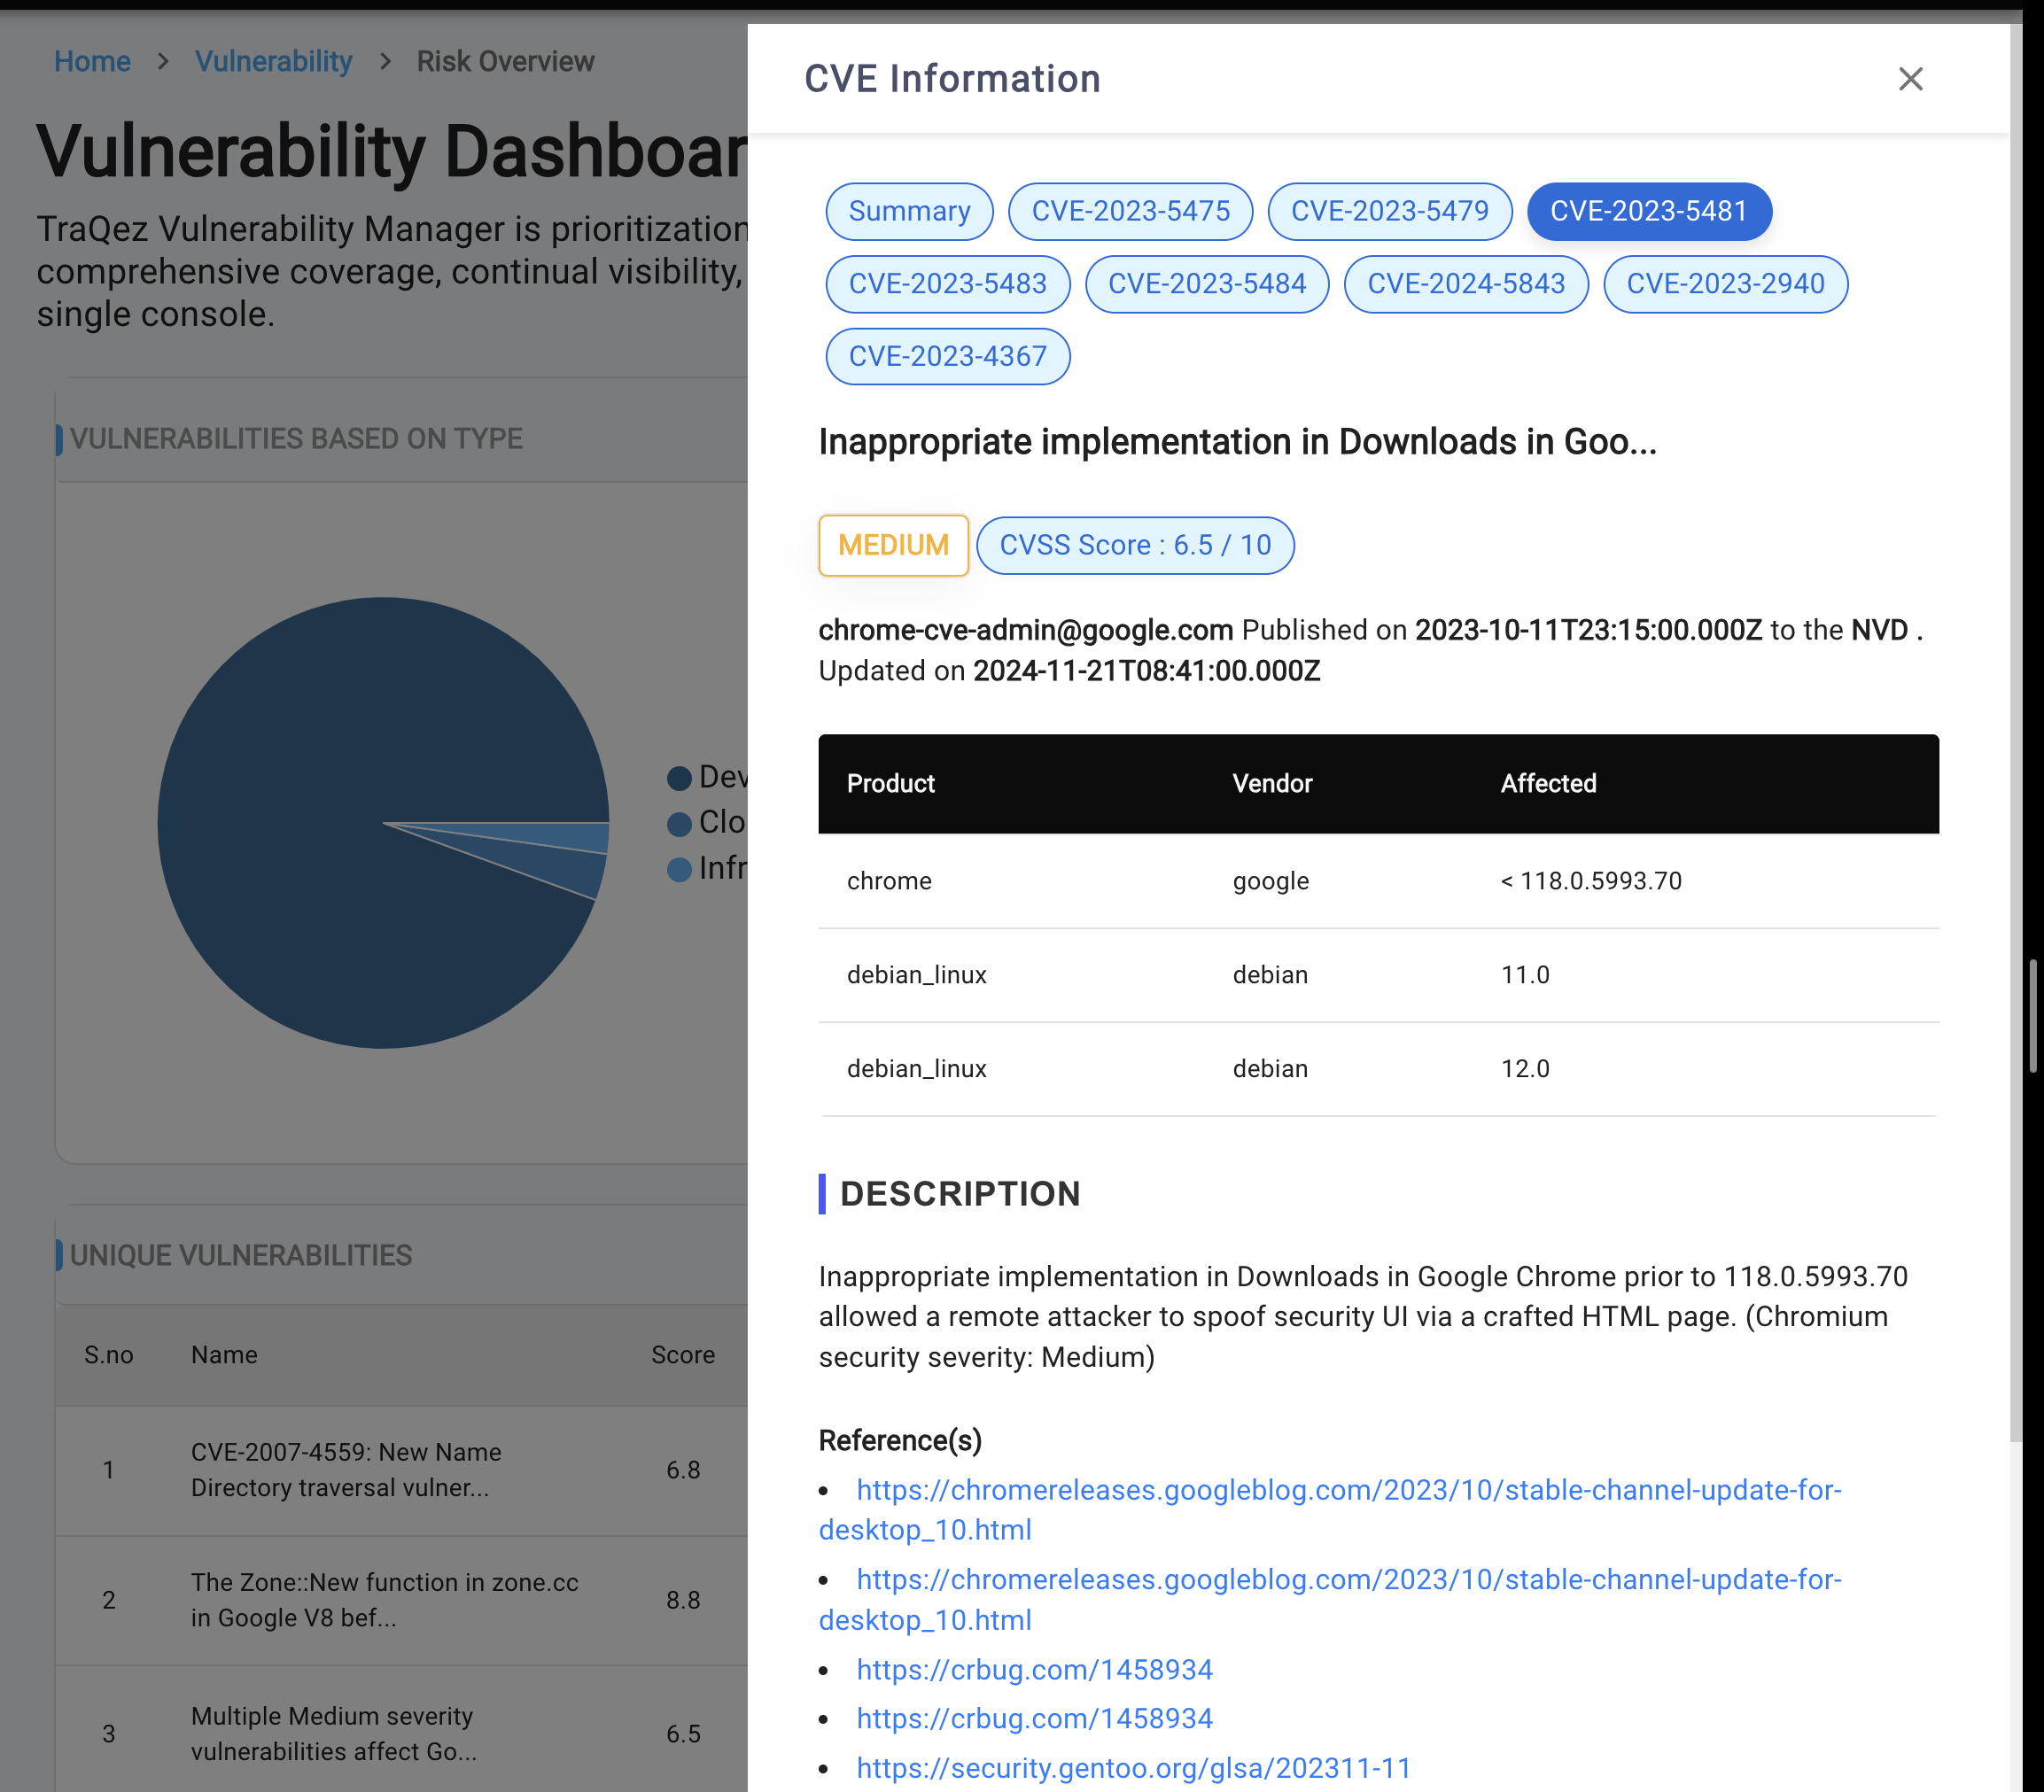
Note that a single vulnerability may have multiple CVE-IDs.
The CVE-ID is presented as a clickable hyperlink. When clicked, a slide-out panel appears, providing detailed information about the CVE, including relevant context and references.
To view a reference image of cve information, click here to expand.
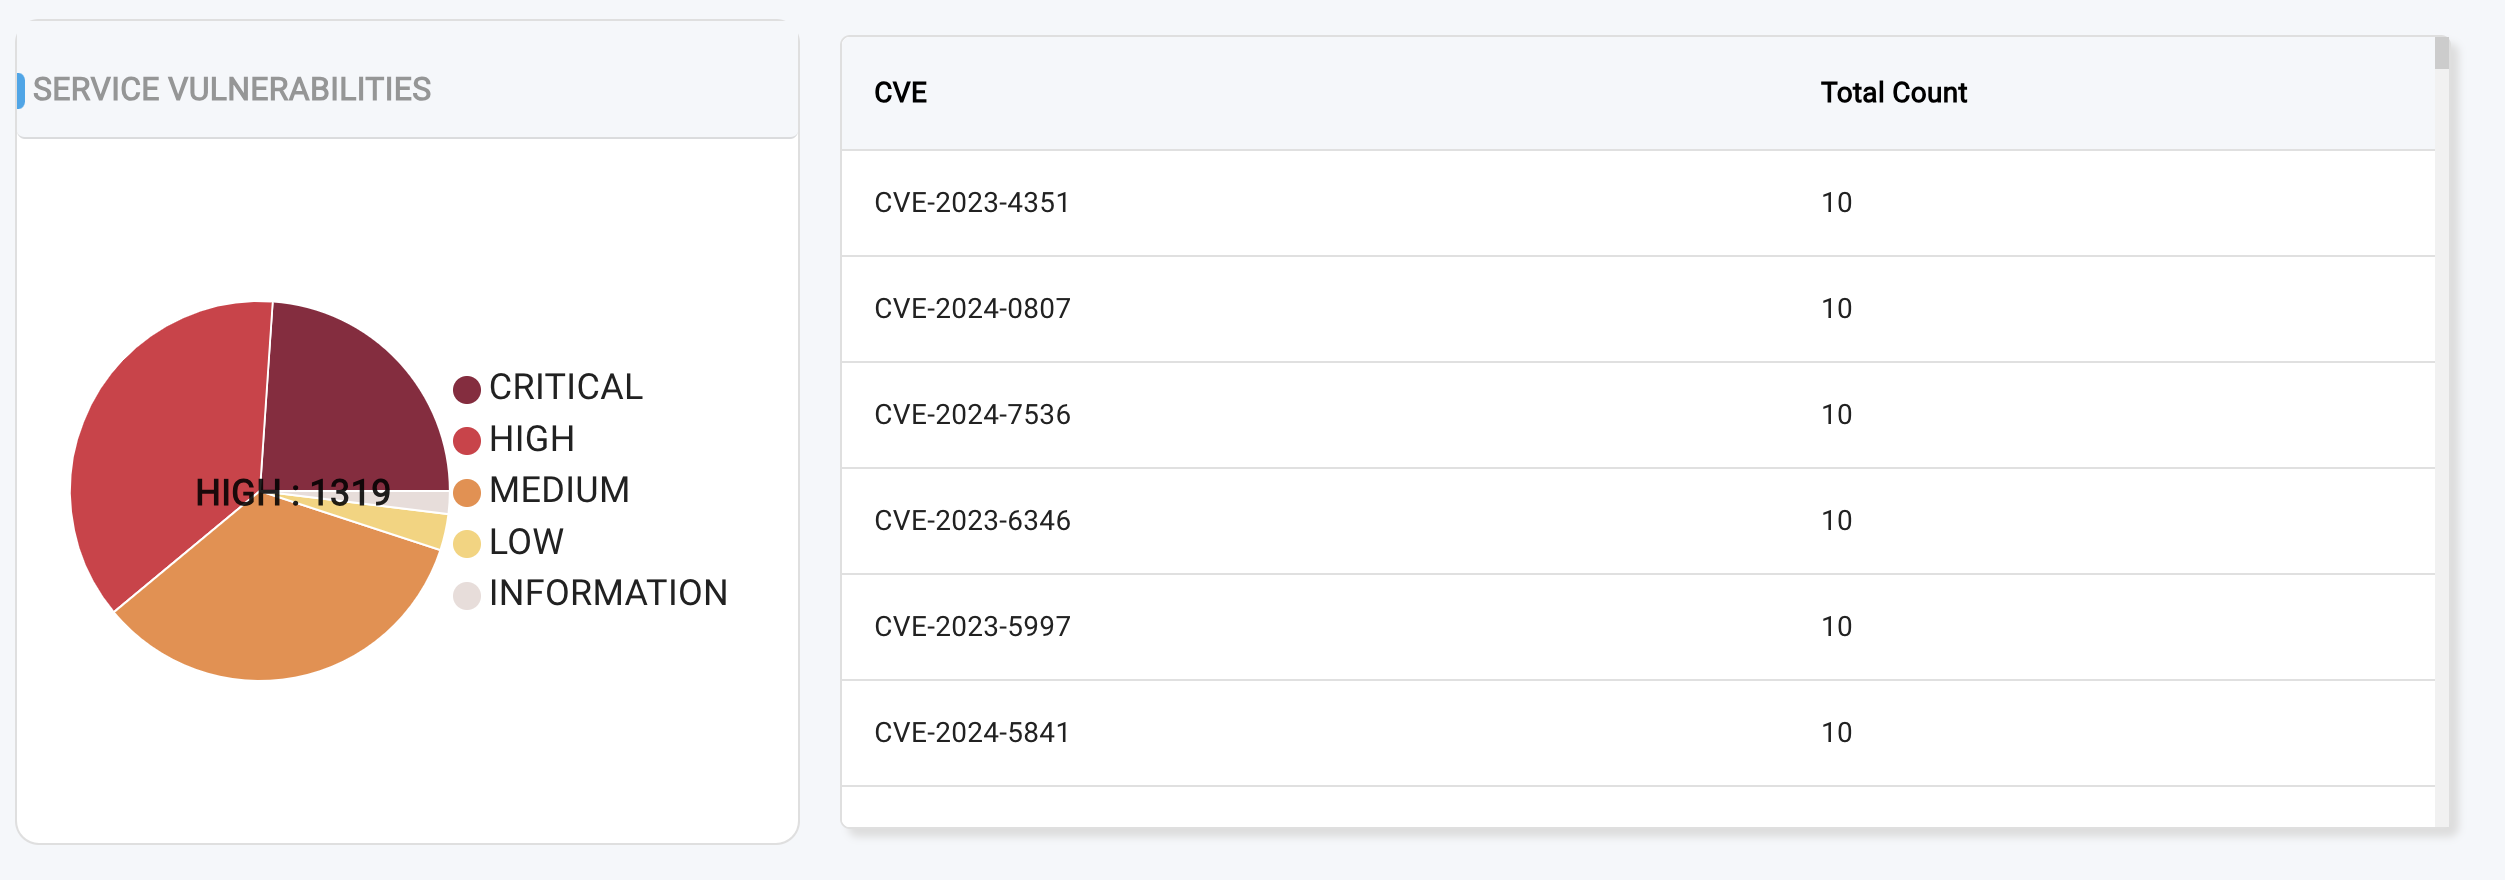
Severity Scores and Impact.
Our severity scoring system categorizes vulnerabilities based on their potential impact. The scores range from 0 to 10 and are classified into five severity levels:
- Critical: Indicates a highly critical vulnerability with severe potential impact. The Score will be between 9 to 10 (including 9 & 10)
(>= 9, <= 10) - High: Represents a significant vulnerability with potential for substantial impact. The Score will be between 7 to 9 (including 7).
(>= 7, < 9) - Medium: Denotes a moderate vulnerability with potential for limited impact. The Score will be between 4 to 7 (including 4).
(>= 4, < 7) - Low: Indicates a minor vulnerability with minimal potential impact. The Score will be between 0 to 4
(> 0, < 4) - Information: Represents a vulnerability with no potential impact, often used for informational purposes only. Score will be zero.
To view a reference image of severity count as pi chart, click here to expand.
Search Filters.
- Search Bar: Quickly search for specific vulnerabilities within the table.
- Sort By: Organize vulnerabilities by Threat, Name, Last Updated, CVE Count, Status.
- Pagination: Navigate through vulnerabilities using the Previous and Next buttons at the bottom of the table. Up to 20 vulnerabilities are displayed at a time.
NOTE: The table displays a consolidated list of unique vulnerabilities across all key areas: Endpoints, Cloud, and Network Perimeter. If a vulnerability is identified in multiple areas, it will be listed only once, eliminating duplicates and providing a streamlined view.
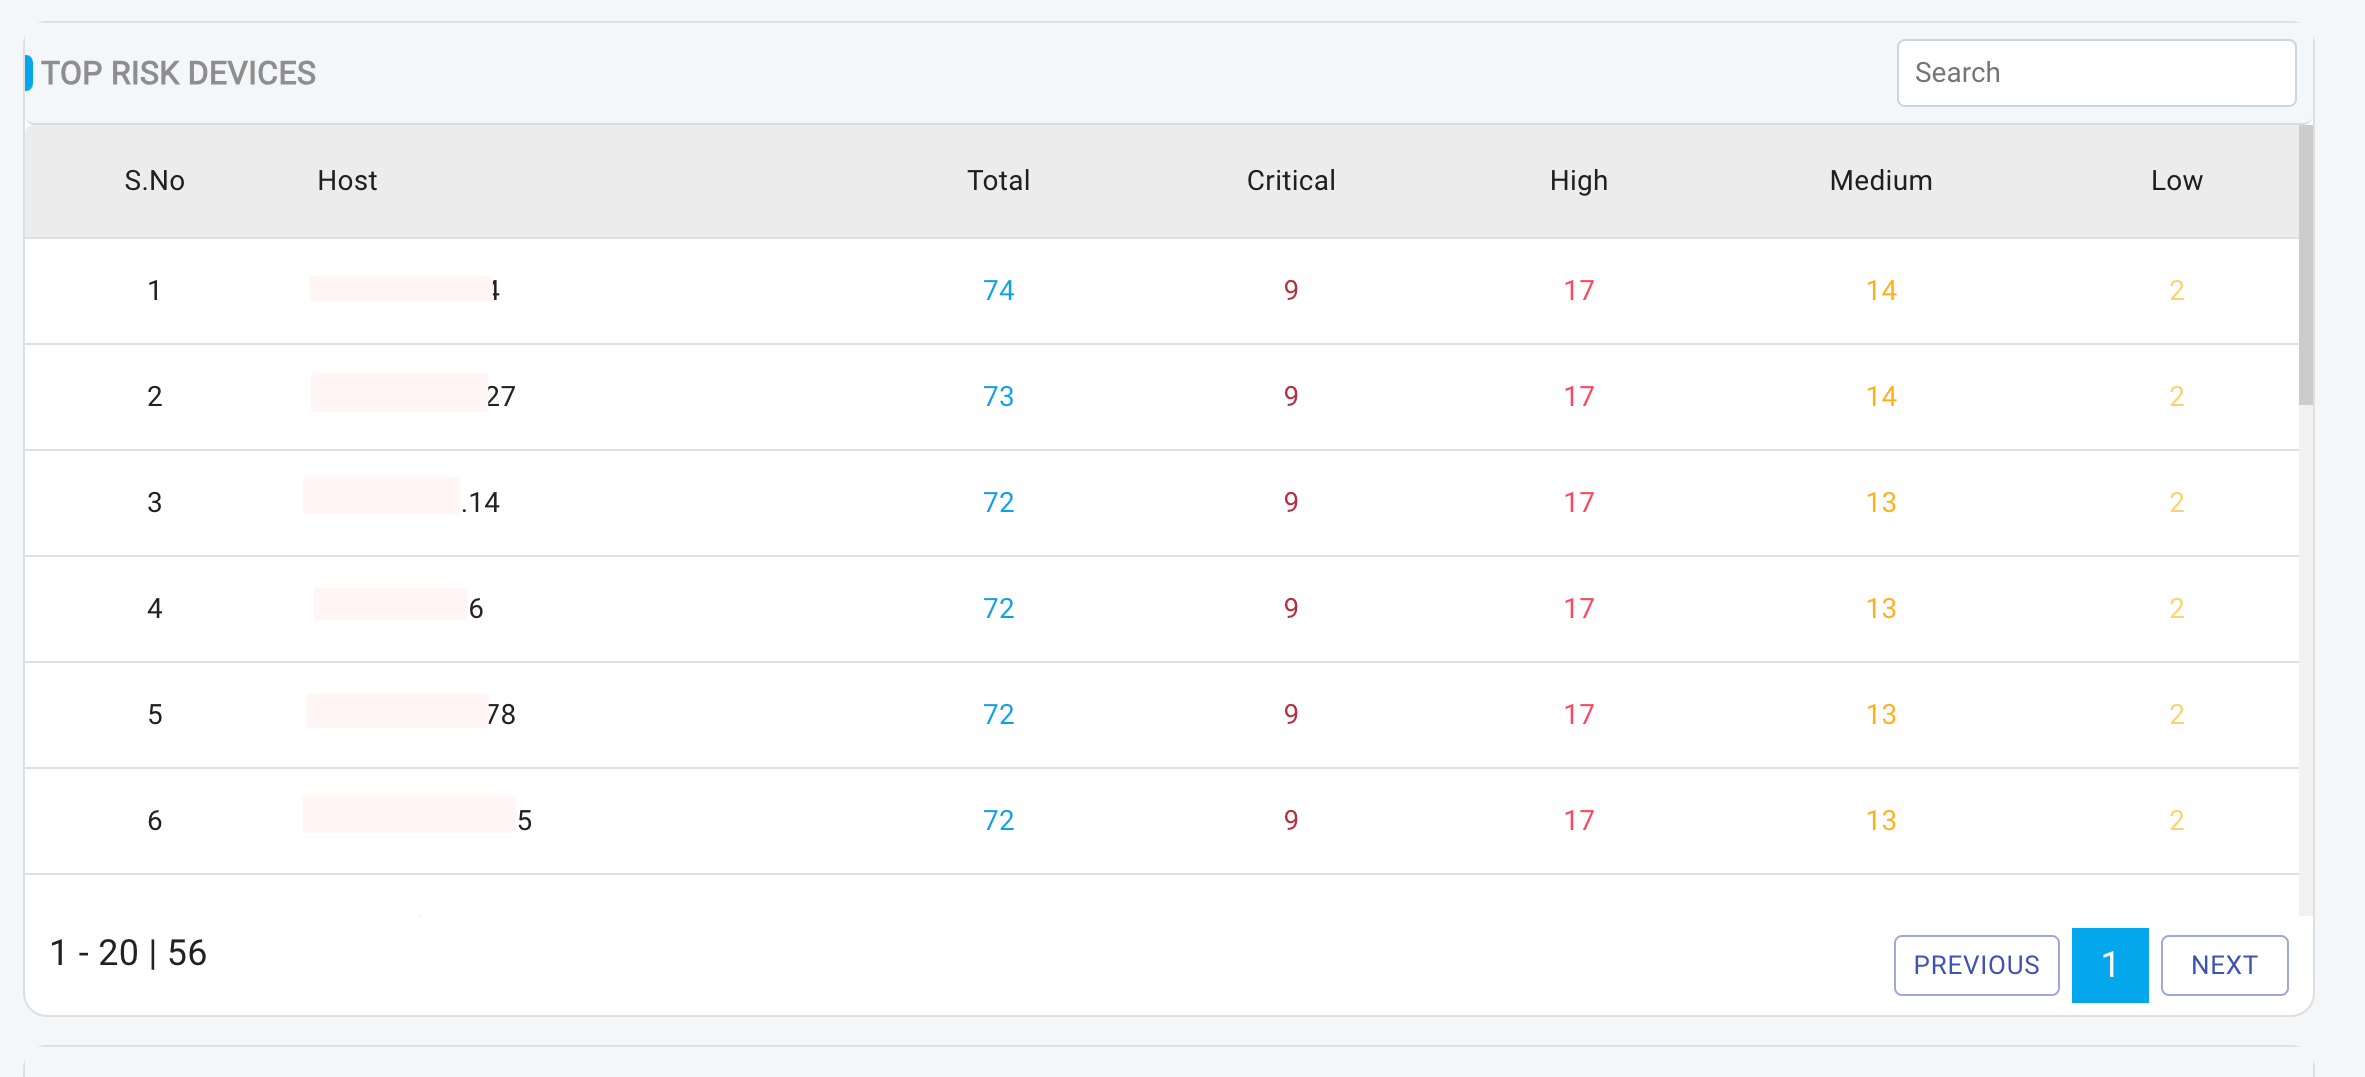
Viewing Scan Results: Top Risk Devices
This table highlights the most at-risk devices within the organization, ranked based on the severity and number of vulnerabilities. The ranking prioritizes devices with:
- Highest number of Critical vulnerabilities
- Highest number of High vulnerabilities
- Highest number of Medium vulnerabilities
- Highest number of Low vulnerabilities
The table contains the following columns:
- Host: Device name or IP address
- Total: Total number of vulnerabilities
- Critical: Number of Critical-severity vulnerabilities
- High: Number of High-severity vulnerabilities
- Medium: Number of Medium-severity vulnerabilities
- Low: Number of Low-severity vulnerabilities
To view a reference image of top risk devices, click here to expand.
Note that the Top Risk Devices section only displays risks identified from: Cloud Workload Risks and Network Perimeter Risks.
Device Risks are not included in this specific section.