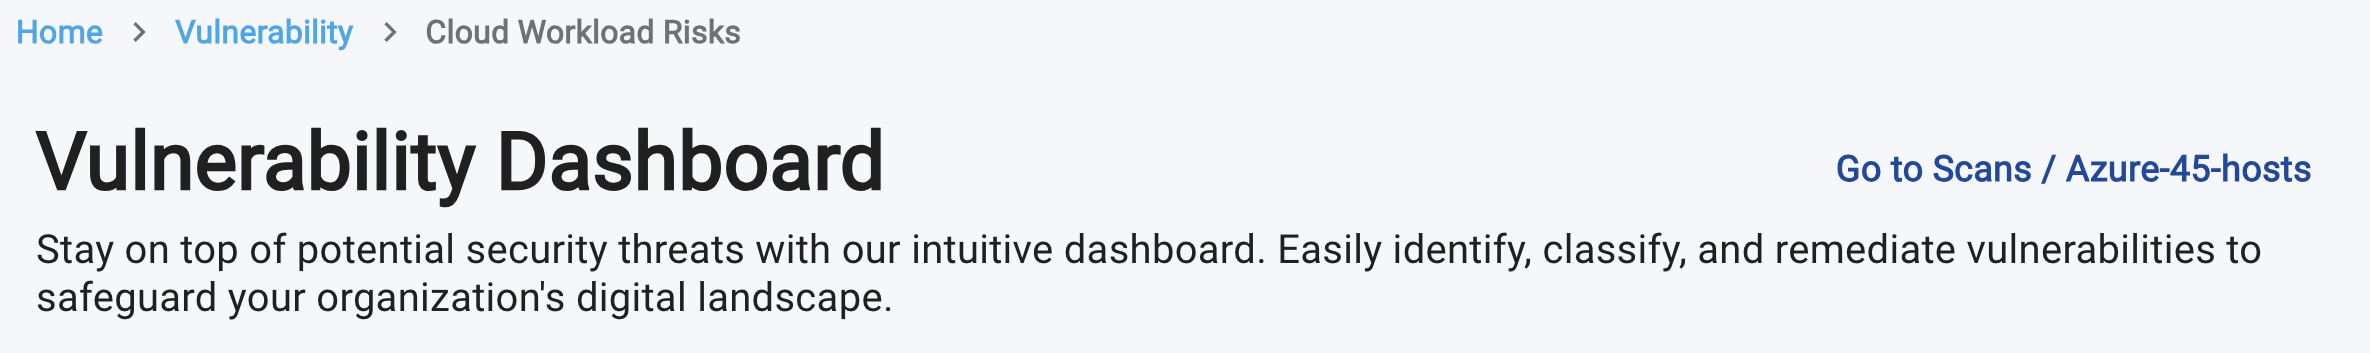
Cloud Workload Scanning
The Cloud Workload Risks page provides a comprehensive overview of vulnerabilities and detailed risk assessments for cloud workloads running on Amazon Web Services (AWS), Microsoft Azure, and Google Cloud Platform (GCP).
How it Works
The process begins with pulling virtual machine details from your cloud environments. The collected details include:
- Virtual machine name
- Instance ID
- Public IP address
- Private IP address
- Region
- Operating system (OS) information
The following is a sample of the data collected from Azure using read-only permissions.
vmId: "5886d101-3817-49d5-86ee-8251581db35d"
vmName: "hemanth-vm2"
location: "eastus"
osKernel: "canonical 0001-com-ubuntu-server-focal 20_04-lts-gen2"
osType: "Linux"
privateIpAddress: "10.0.0.8"
publicIpAddress: "20.185.25.32"
- After collecting virtual machine details, the public IP address is scanned for:
- Open Ports: Identifying open ports to determine accessible services.
- Service Enumeration: Identifying running services and applications.
- Next, the system:
- Queries Vulnerability Databases: Searches databases like NVD and Mitre for corresponding vulnerabilities.
- Runs Vulnerability Scripts: Executes scripts to verify the presence of identified vulnerabilities.
This comprehensive process ensures accurate vulnerability detection and reporting.
Requirements
- Virtual Machine Support: Cloud Workload vulnerability scanning only supports virtual machines running in cloud environments.
- Scan Capabilities: Scans any virtual machine and operating system.
- Requires read-only access to pull virtual machine details from your cloud environments.
Creating new Scan
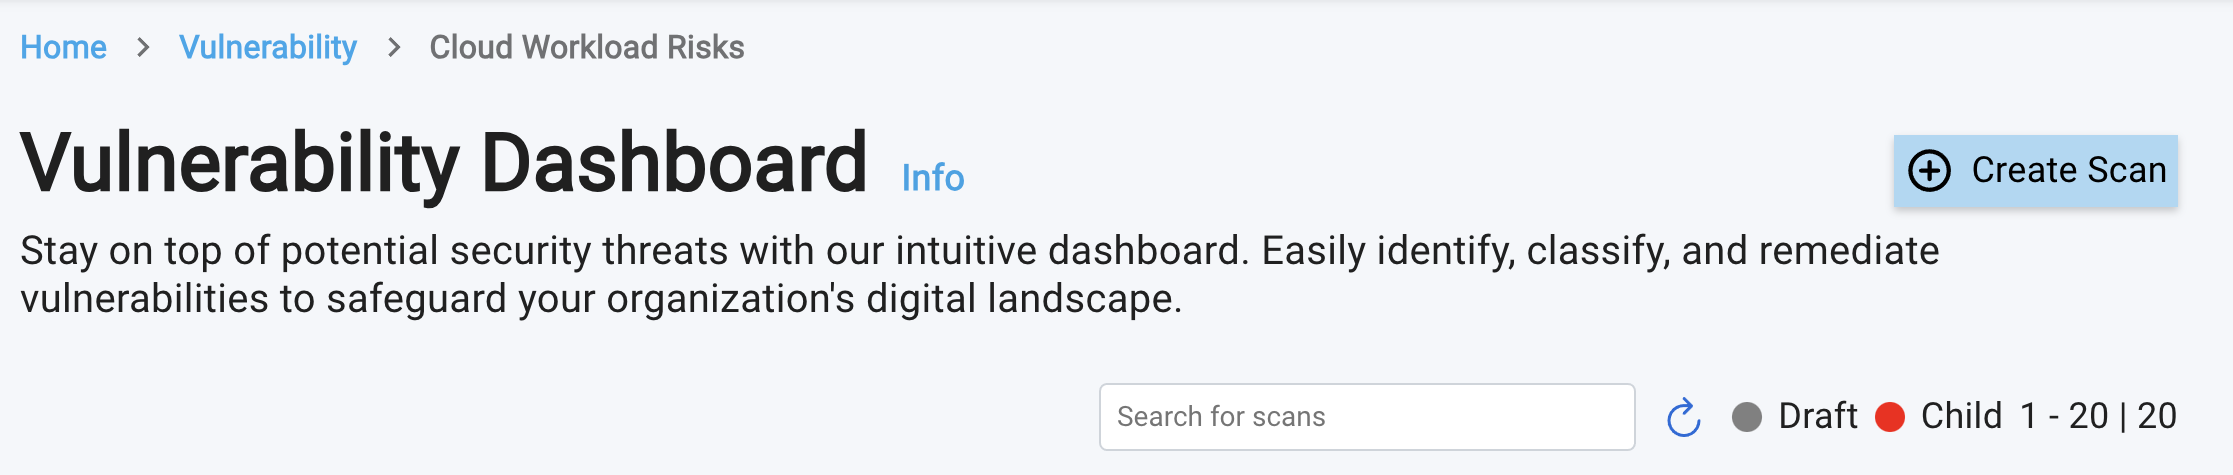
- To initiate a new scan, Locate the
Create Scanbutton in the top right corner of the current page and click on it.
To view a reference image of create scan button, click here to expand.
- A Slide-over panel will appear, prompting you to select your cloud provider from the dropdown menu:
- AWS (default)
- Azure
- GCP
- After selecting your cloud provider, you'll need to provide access credentials using one of the following methods:
Reuse Existing ConnectorandManual Credential Entry.
To view a reference image of importing resources, click here to expand.
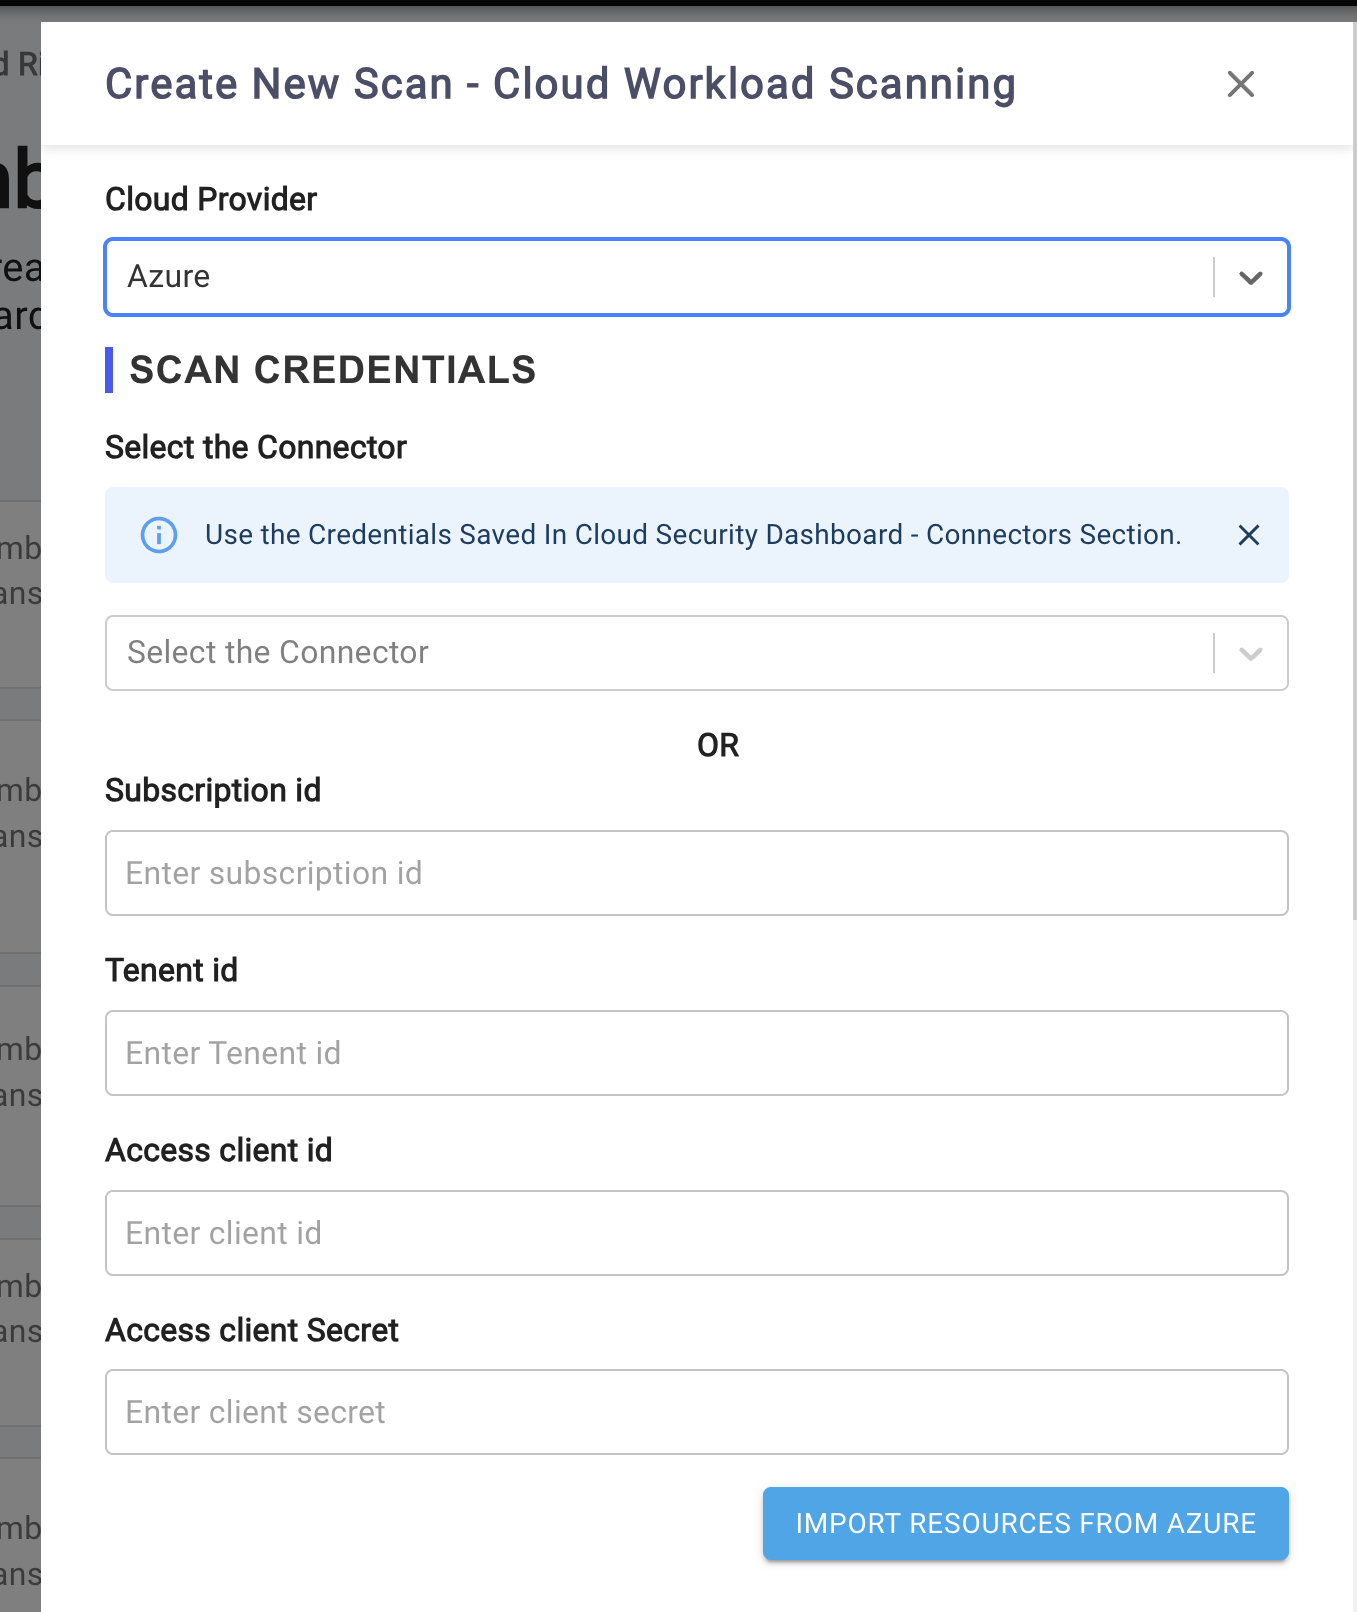
- Reuse Existing Connector: Leverage existing connectors to authenticate. If you've already configured access keys and secrets in the
Cloud Security (CSPM) Dashboard, you can reuse them. Click on theSelect Connectordropdown, Choose the connector from the list.
NOTE: For detailed instructions on creating a new connector, refer to: Cloud Security (CSPM) → Connector Dashboard
- Manual Credential Entry: Provide required credentials via text boxes in the interface. The following are required.
- For AWS: Account Id, Access Key, Access Token
- For Azure: Subscription Id, Tenant Id, Access Client Id, Access Client Secrent.
- For GCP: The credentials JSON data is required.
For detailed instructions on setting up read-only access permissions for your cloud environments, please refer to the section:
Read Only Access Permissions for Cloud Environmentswithin this document. This section provides step-by-step guidance on: Creating roles, Assigning permissions and Generating keys and secrets
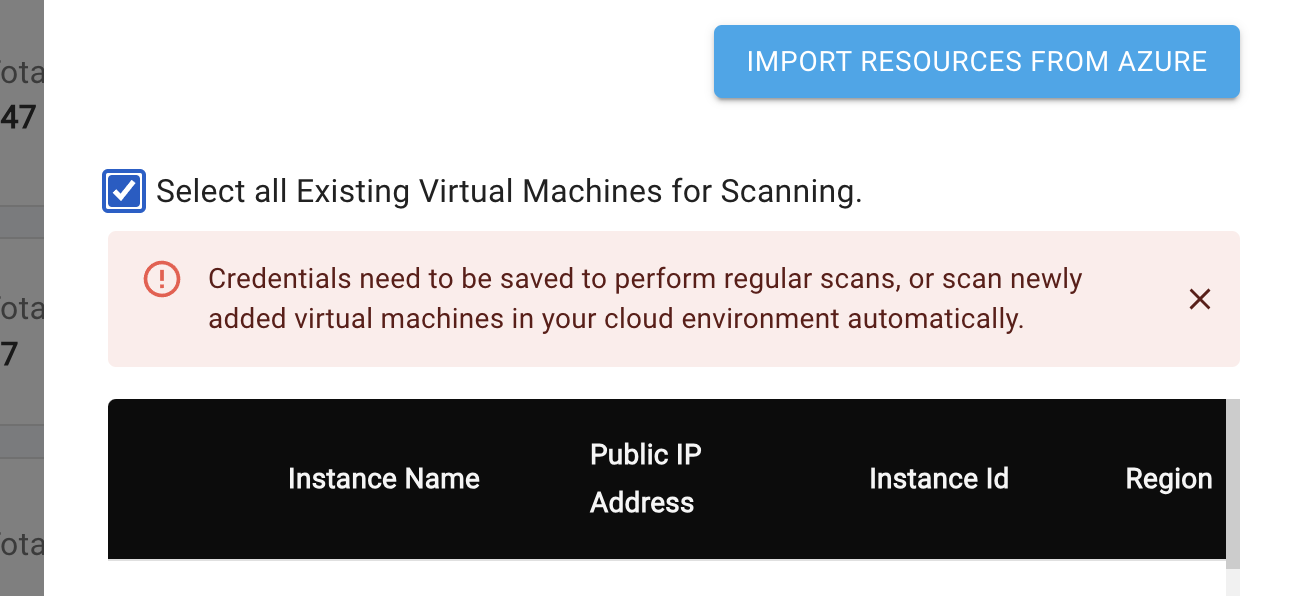
- Click the
Import Resourcesbutton to import all virtual machine details from your cloud environment.
To view a reference image of Imported resources, click here to expand.
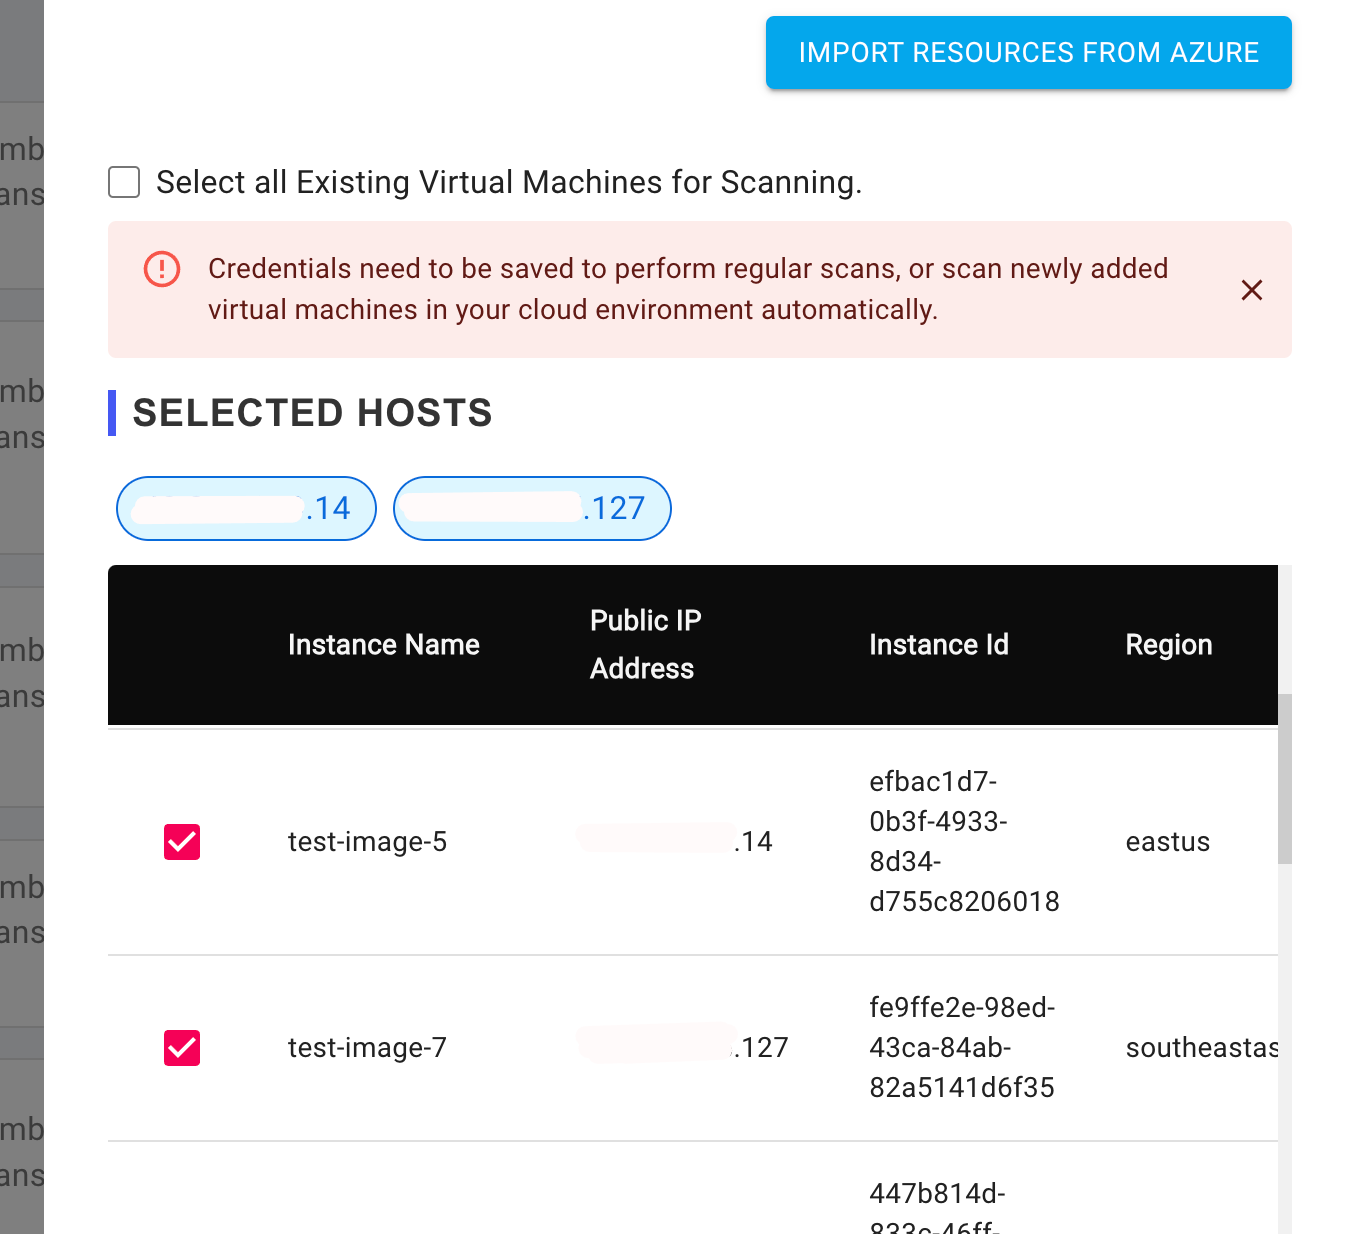
- Now that your cloud provider credentials are set up, and resources are imported, the next step is to configure your scan.
- The following are Required Fields:
- Scan Name
- Security Scan Type
- Scan Settings
- The following are the Optional Fields:
- Scan Description & Tags (Optional)
- Scan Options. (Optional, if left blank, default settings will be used.)
- Scan Name: Enter a unique and descriptive name for your scan. This name will serve as a identifier, allowing you to easily recognize and manage your created scans, as well as their associated settings.
- Scan Description: Add a brief summary or notes about your scan to help with identification and organization. This field is optional, but can be useful for future reference.
- Tags: Assign relevant keywords or tags to your scan for easy categorization and filtering.
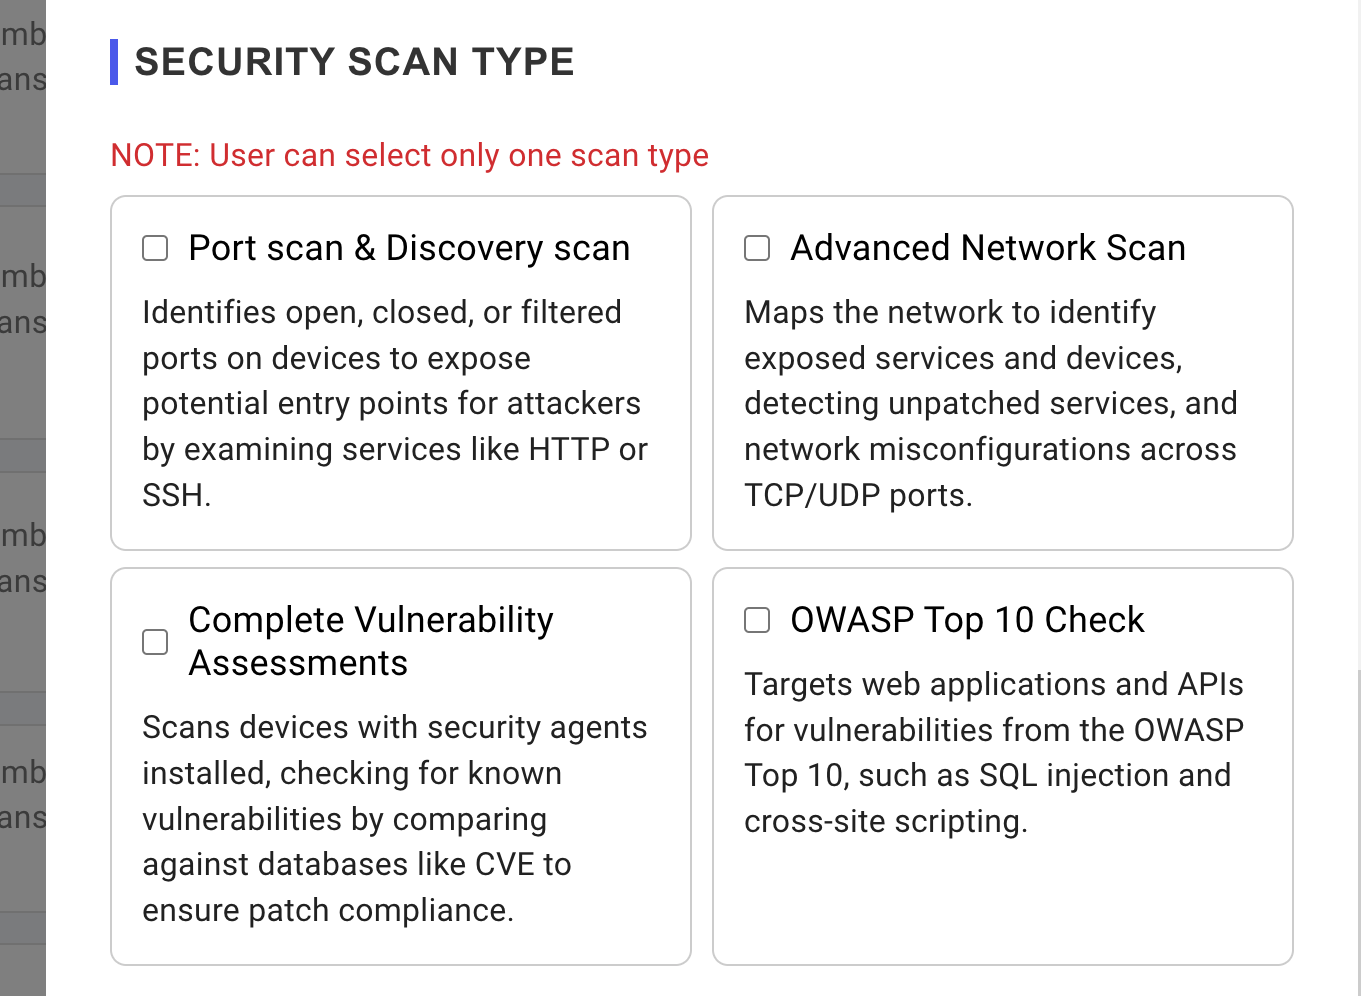
- Security Scan Type: This section allows user to define the scope and depth of your vulnerability scan. The following scan types are available:
Port scan & Discovery scan: Identify Open ports and services. Typical scan times range from as little as 1 minute to 10 minutes (average time).Advanced Network Scan: Maps the network to identify exposed services and devices, detecting unpatched services, and network misconfigurations across TCP/UDP ports. Typical scan times range from as little as 5 minutes to 1 hour (average time: 30 min). The vulnerability scan duration varies depending on the number of IPs, ports, and services being scanned.Complete Vulnerability Assessments: This comprehensive vulnerability assessment conducts an in-depth examination, scanning for over 50,000 vulnerability tests and checking against more than 250,000 CVE vulnerabilities.OWASP Top 10 Check: Scan your websites and APIs for the most critical vulnerabilities identified by OWASP. This unauthenticated scan performs black box testing to identify potential weaknesses in your applications.
NOTE: Typical scan times range from as little as 5 minutes to 1 hour (average time: 30 min). The vulnerability scan duration varies depending on the number of IPs, ports, and services being scanned. Complete Vulnerability Assessments takes longer time than other scans.
To view a reference image of available scan types, click here to expand.
- Scan Settings: Configure the frequency of your scans and email report settings in this section. You can modify these settings at any time, even after the scan has been created.
- Configure periodic vulnerability scanning by selecting the
Perform periodic scanning for new vulnerabilitiesoption:- Daily: Scan assets daily at a specified time.
- Weekly: Scan assets weekly on a chosen day (e.g., Friday, Saturday) at a specified time.
- Bi-Weekly: Scan assets every other week on a chosen day at a specified time.
- Monthly: Scan assets monthly on a chosen day within the first week of the month at a specified time.
- Schedule a one-time scan for a future date and time by selecting the
Schedule Scan at given time and run only once.option. The scan will execute at the specified time based on your configured user timezone.
Note: When enabling periodic/continuous scanning, the configured scan time will be executed in UTC Timezone. For example, if you schedule a scan for 4:00 am, it will run at 4:00 am UTC, not 4:00 in your local timezone.
- Scan Options: Customize the behavior of the vulnerability scanner and refine your results using the following options:
Do not Perform Stealth mode Scanning (No TCP scan):By default, a TCP SYN scan is performed, which is the recommended scan method. It's advised to leave this setting unchanged. Enabling the option may trigger ping or ARP scans, which can be blocked by firewalls, resulting in a "Host Down" error.Scan Top TCP Ports (Top 1000 ports / IANA assigned ports will be used):Scan's top 1000 tcp ports or IANA assigned ports only.Run all vulnerability scripts aggressively during Advanced Network Scan:Enabling this option will initiate a comprehensive and aggressive vulnerability scan, which includes Denial of Service (DoS) attacks and intensive vulnerability tests. These tests may potentially crash or disrupt services, so proceed with cautionAggressively scan website for OWASP top 10. Enabling this option will run scan in active mode instead of passive mode.- Save all scan artifacts for later reference. Select this option to store all scan-related data, including logs and evidence, for future reference. This will retain raw data generated during the scan.
- Save vulnerabilities with information/log level. Log information level messages from the vulnerability scanner which includes enumeration information, service information etc. Also useful for asset discovery and mapping.
Managing Existing Scans
- After creating a scan, navigate to the Device Risks page to view a list of all created scans in an accordion-style layout. This means that each scan will be displayed in a collapsible panel, showing key information such as:
- Project: Scan name (alias)
- Tags: Associated tags
- Scan History: Number of scans completed to date
- Last Scan Findings: Total vulnerabilities detected in the last scan
- Last Scan Status: Status of the most recent scan
- Severity Level Summary: Summary of findings based on severity from the last scan
To view a reference image of all created scans, click here to expand.
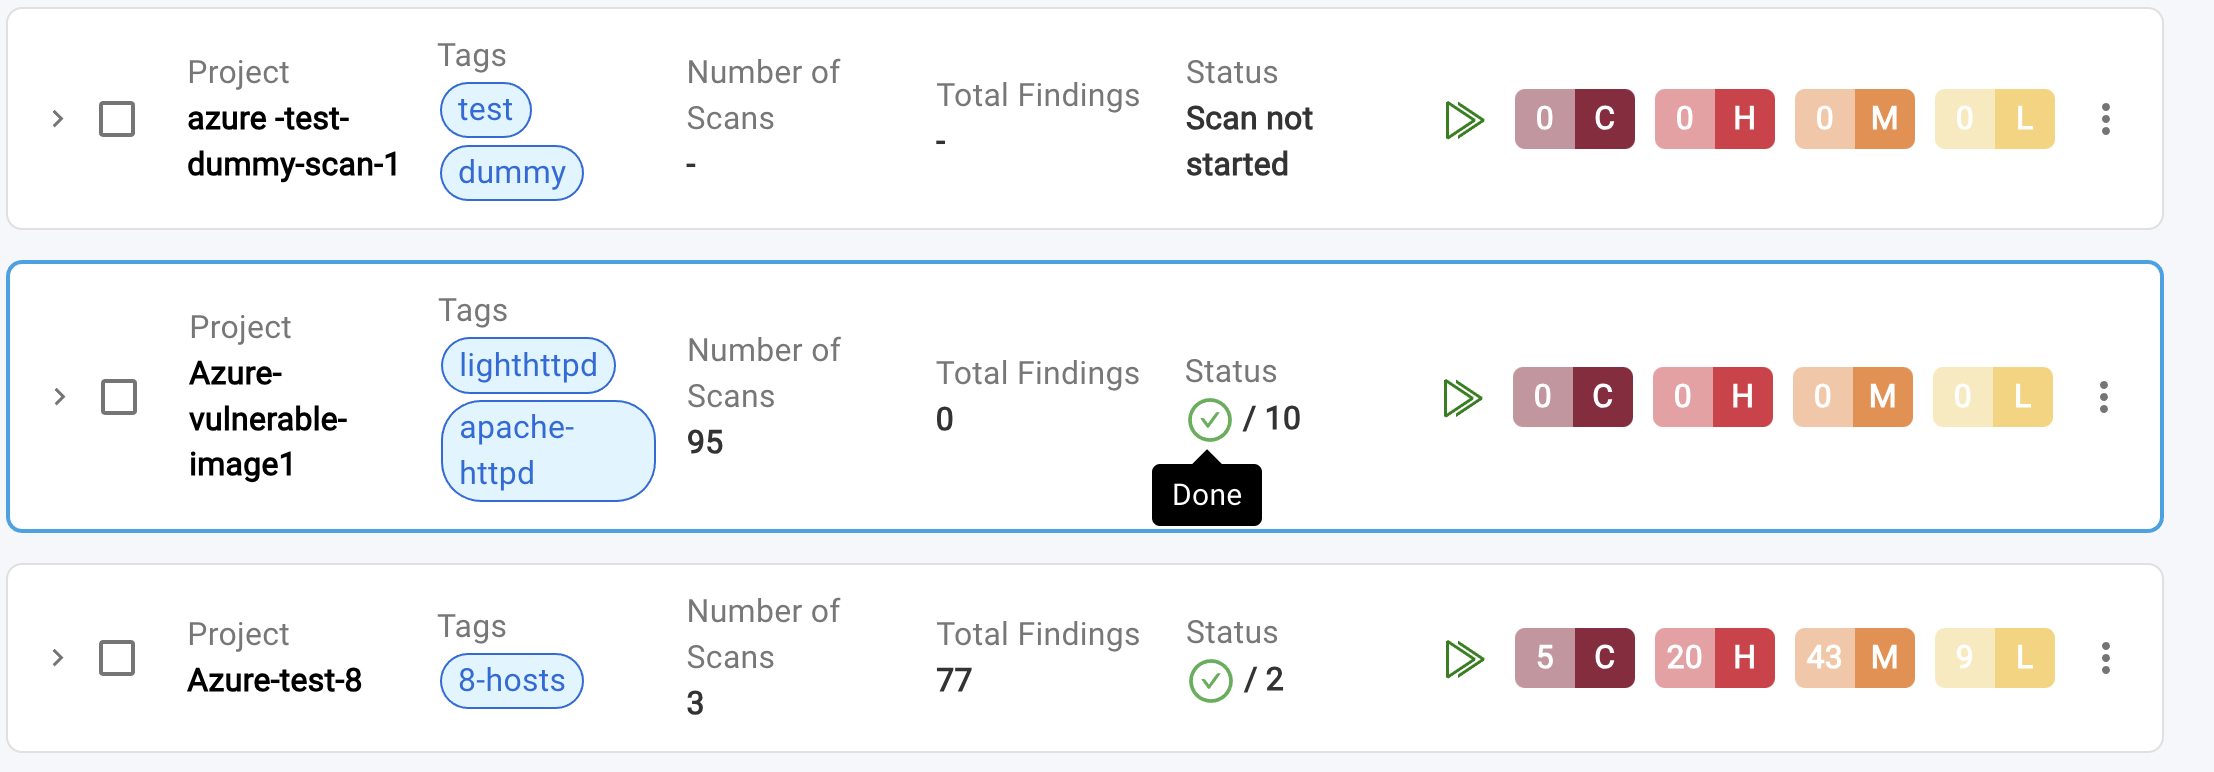
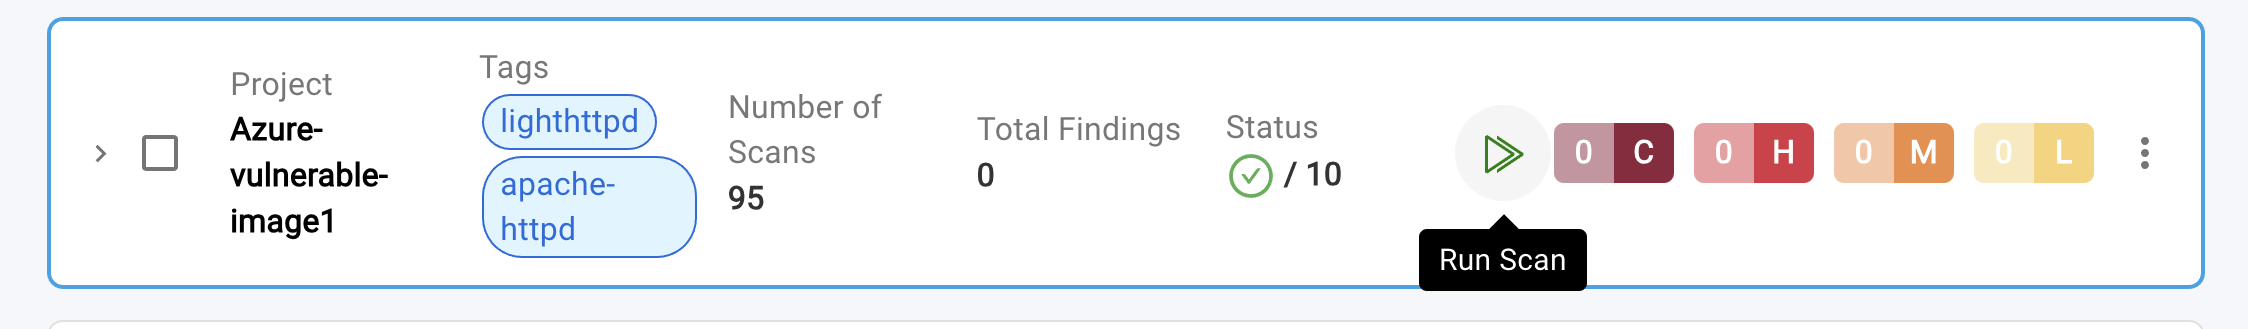
- Additionally following icons and options are available within accordion:
- Run Icon: Launch the scan
- Triple Dots Icon: Edit or delete the scan
- Arrow Icon >: View job details of the last scan (expand the accordion)
- Checkbox: Select scans for bulk deletion
- Severity Level Notations: Severity Level are indicated by the following abbreviations:
- C: Critical
- H: High
- M: Medium
- L: Low
- Here's what each scan status indicates:
Done: All jobs have succeeded, and vulnerability scanning and assessment have been completed on all endpoints.Partially Done: At least one job has failed, while others may have succeeded.Failed: All jobs have failed.Running: At least one job is currently running.Scan Submit Error: The scanner is unavailable, or the administrator has reached the scan limit or IP limit.
- Clicking the arrow mark
>expands the accordion to display job details, providing valuable information to troubleshoot failed scans at individual or grouped endpoints.
To view a reference image of job details, click here to expand.
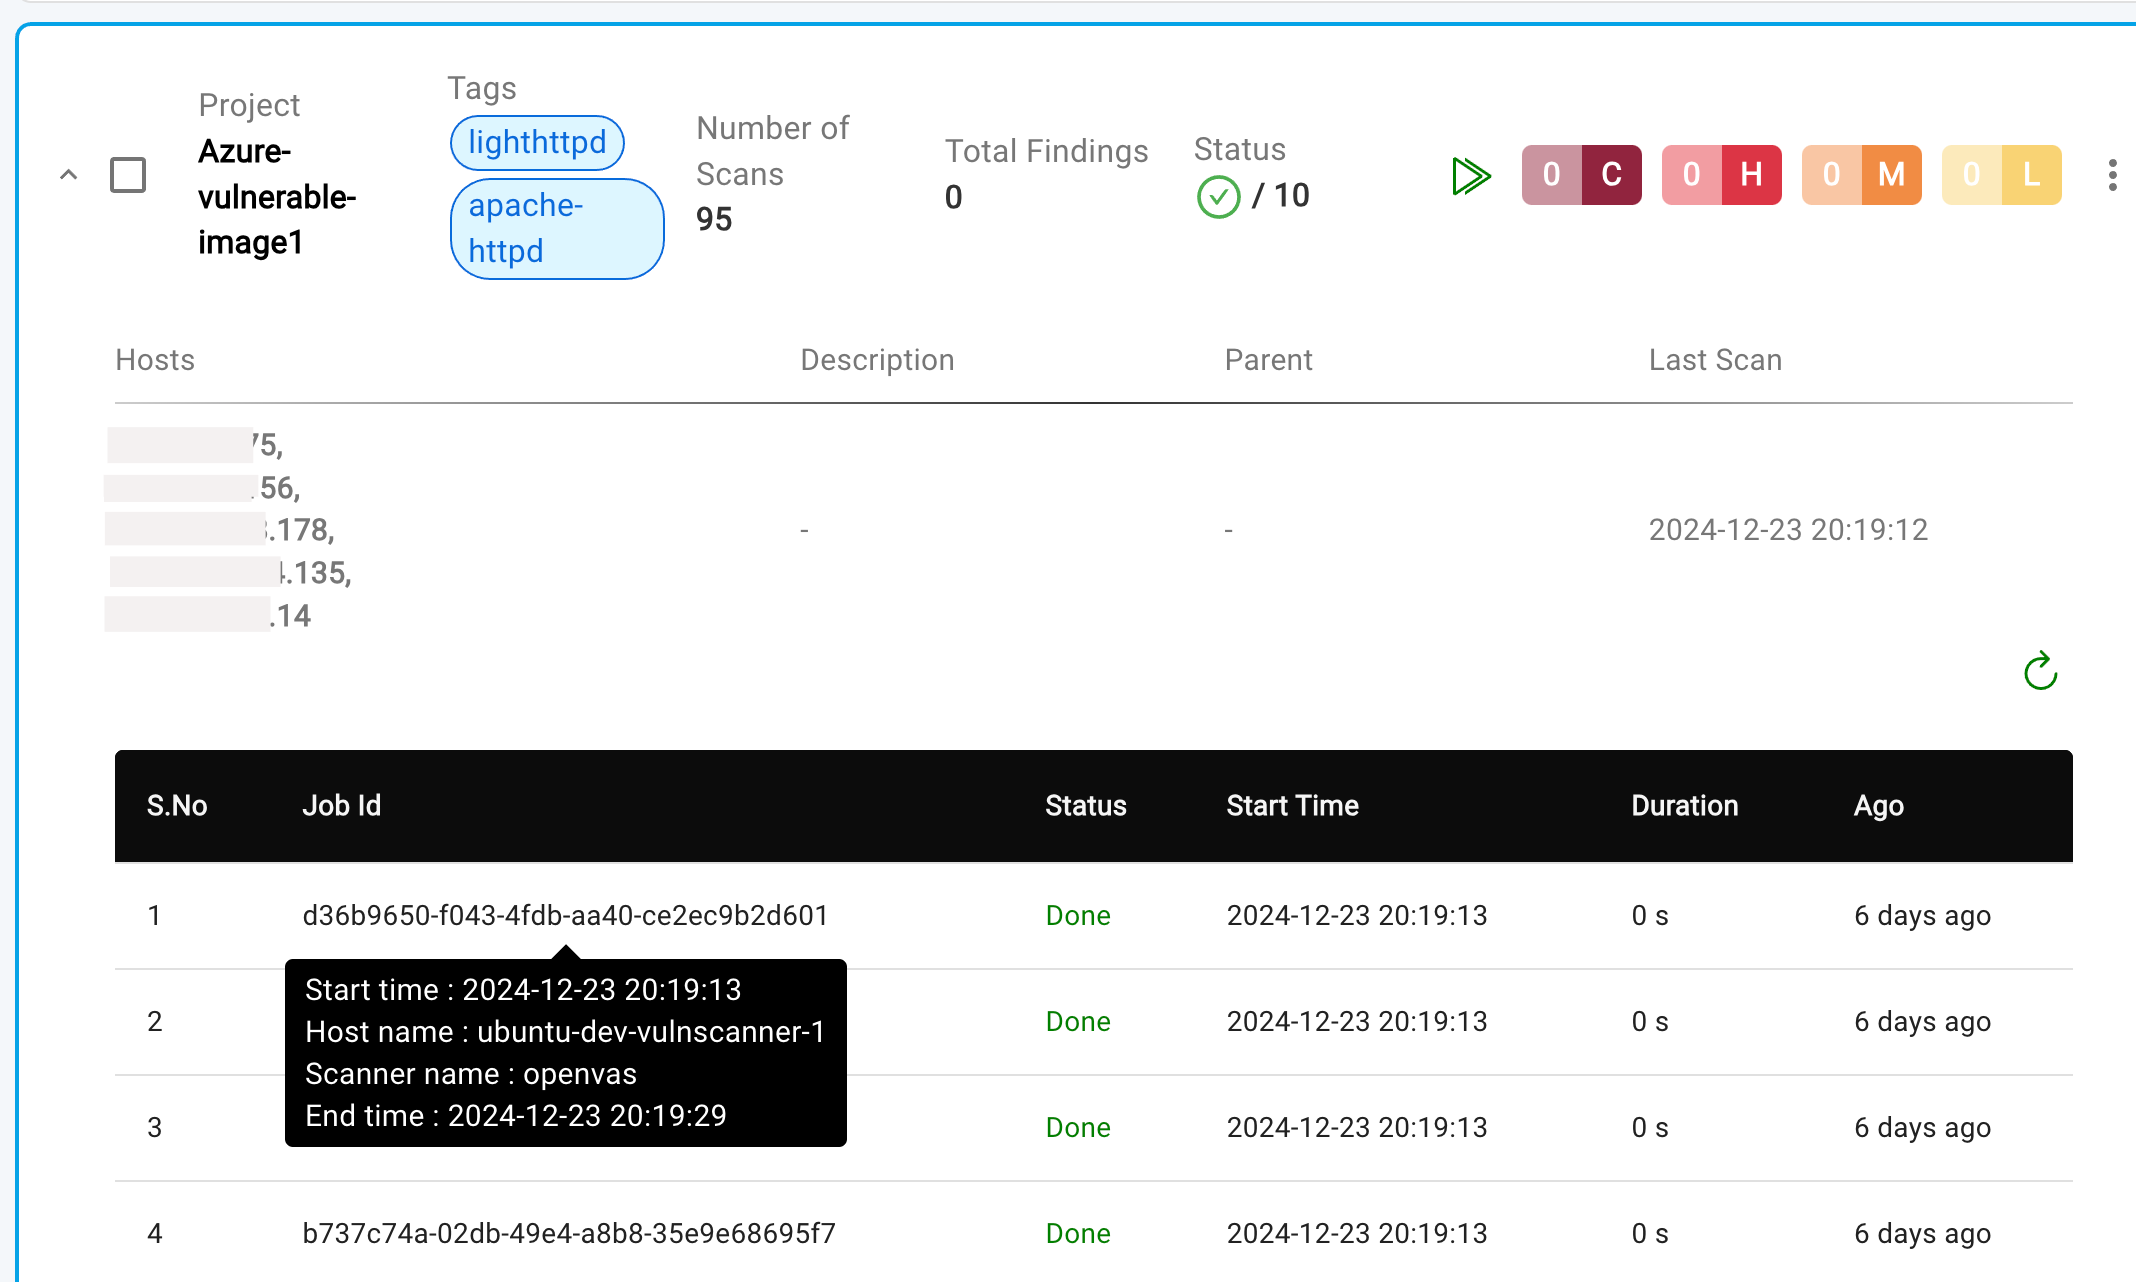
- Additionally, the job would have
QueuedStatus, indicating, the device is ready for the scan and waiting for execution.
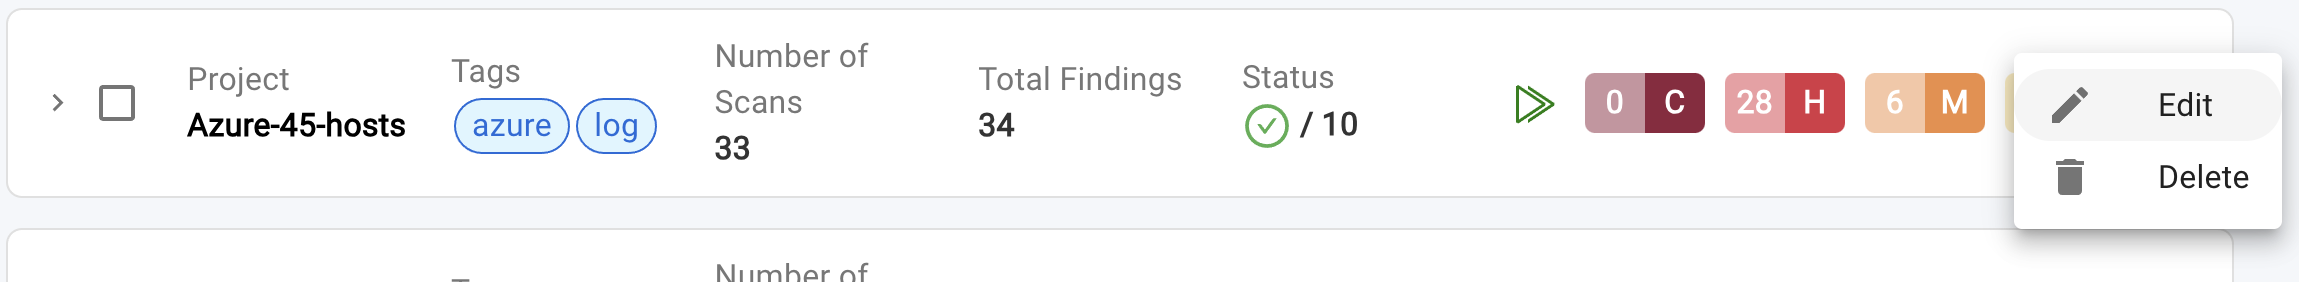
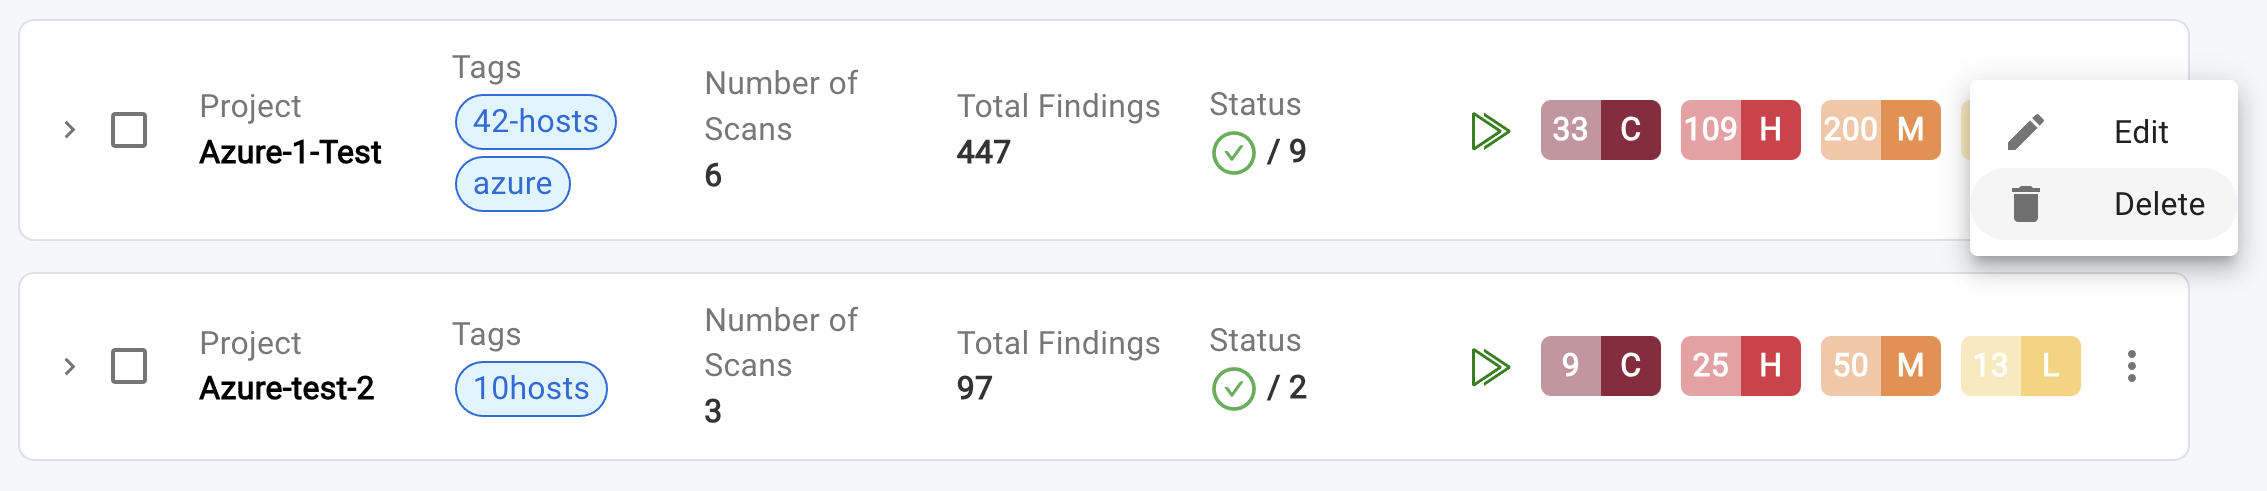
Editing Scan details
- The Scan can be edited by
Selecting the three vertical dots(also called asMore OptionsorVertical Ellipsis). The slide-out panel will appear, pre-populated with the details you entered when creating the scan.
To view a reference image of editing the scan, click here to expand.
- During Edit, the
Cloud Providercannot be changed. - You can modify the following during scan editing:
- Scan name, description, tags
- Security Scan type
- Scan Settings
- Scan Options
- If
Select all Existing Virtual Machines for Scanningis selected during scan creation, it cannot be disabled, and IP addresses cannot be added or removed. - When specific IP addresses are selected during scan creation, new IP addresses can be added or removed during editing, but the "Select all Existing Virtual Machines for Scanning" option cannot be enabled.
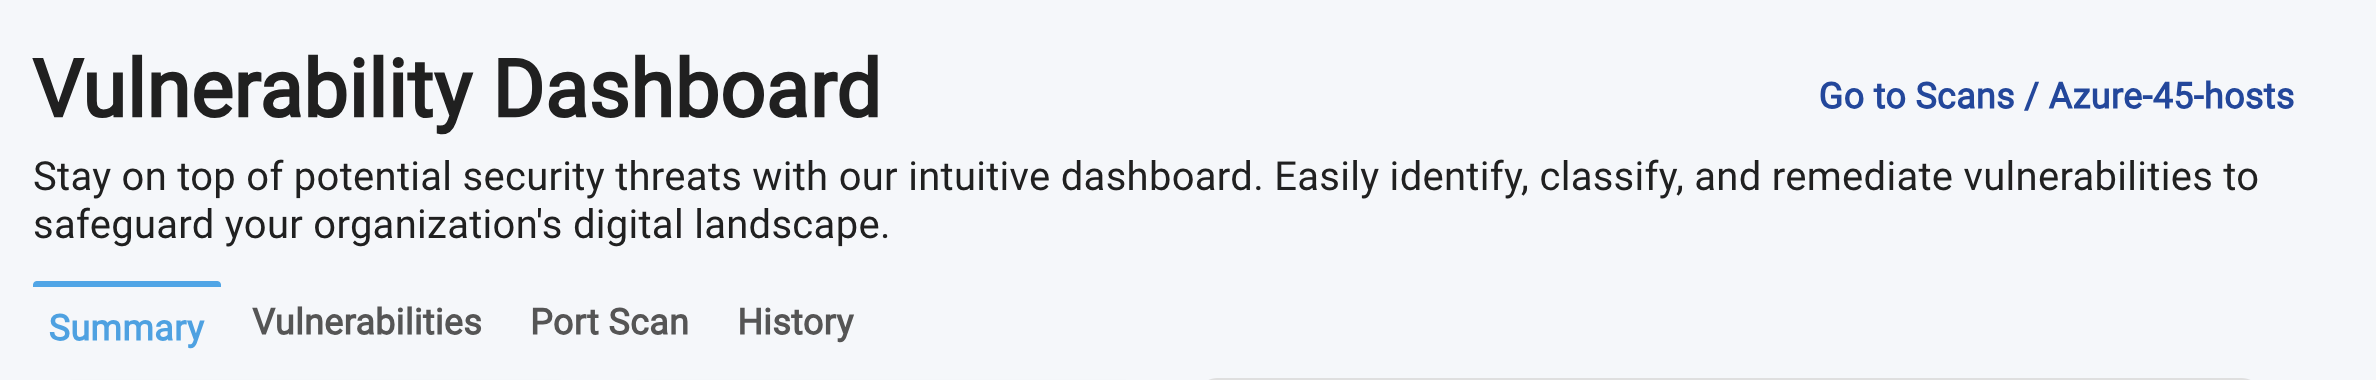
Viewing Scan Results
To view scan results, click on the Project (or Scan Name) within the accordion. A new page will open, featuring a tabbed pane with four tabs:
- Summary: Overview of the scan results
- Vulnerabilities: Detailed list of detected vulnerabilities (default tab)
- Port Scan: Detailed list of detected ports and services
- History: Scan history and previous results
To view a reference image of tabbed pane with four tabs, click here to expand.
Vulnerabilities Tab
- This is the default tab that opens when a Project is clicked. It opens a new Vulnerabilities Results Dashboard, which appears like below:
Click here to expand and view vulnerabilities results.

- By default, vulnerabilities are displayed in the following order:
Newest Vulnerabilities: New vulnerabilities are displayed before existing ones, ensuring that the latest findings are prominently visible.Highest Threat Level/Severity Score: Vulnerabilities are sorted by their threat level or severity score, with the most critical ones appearing first.
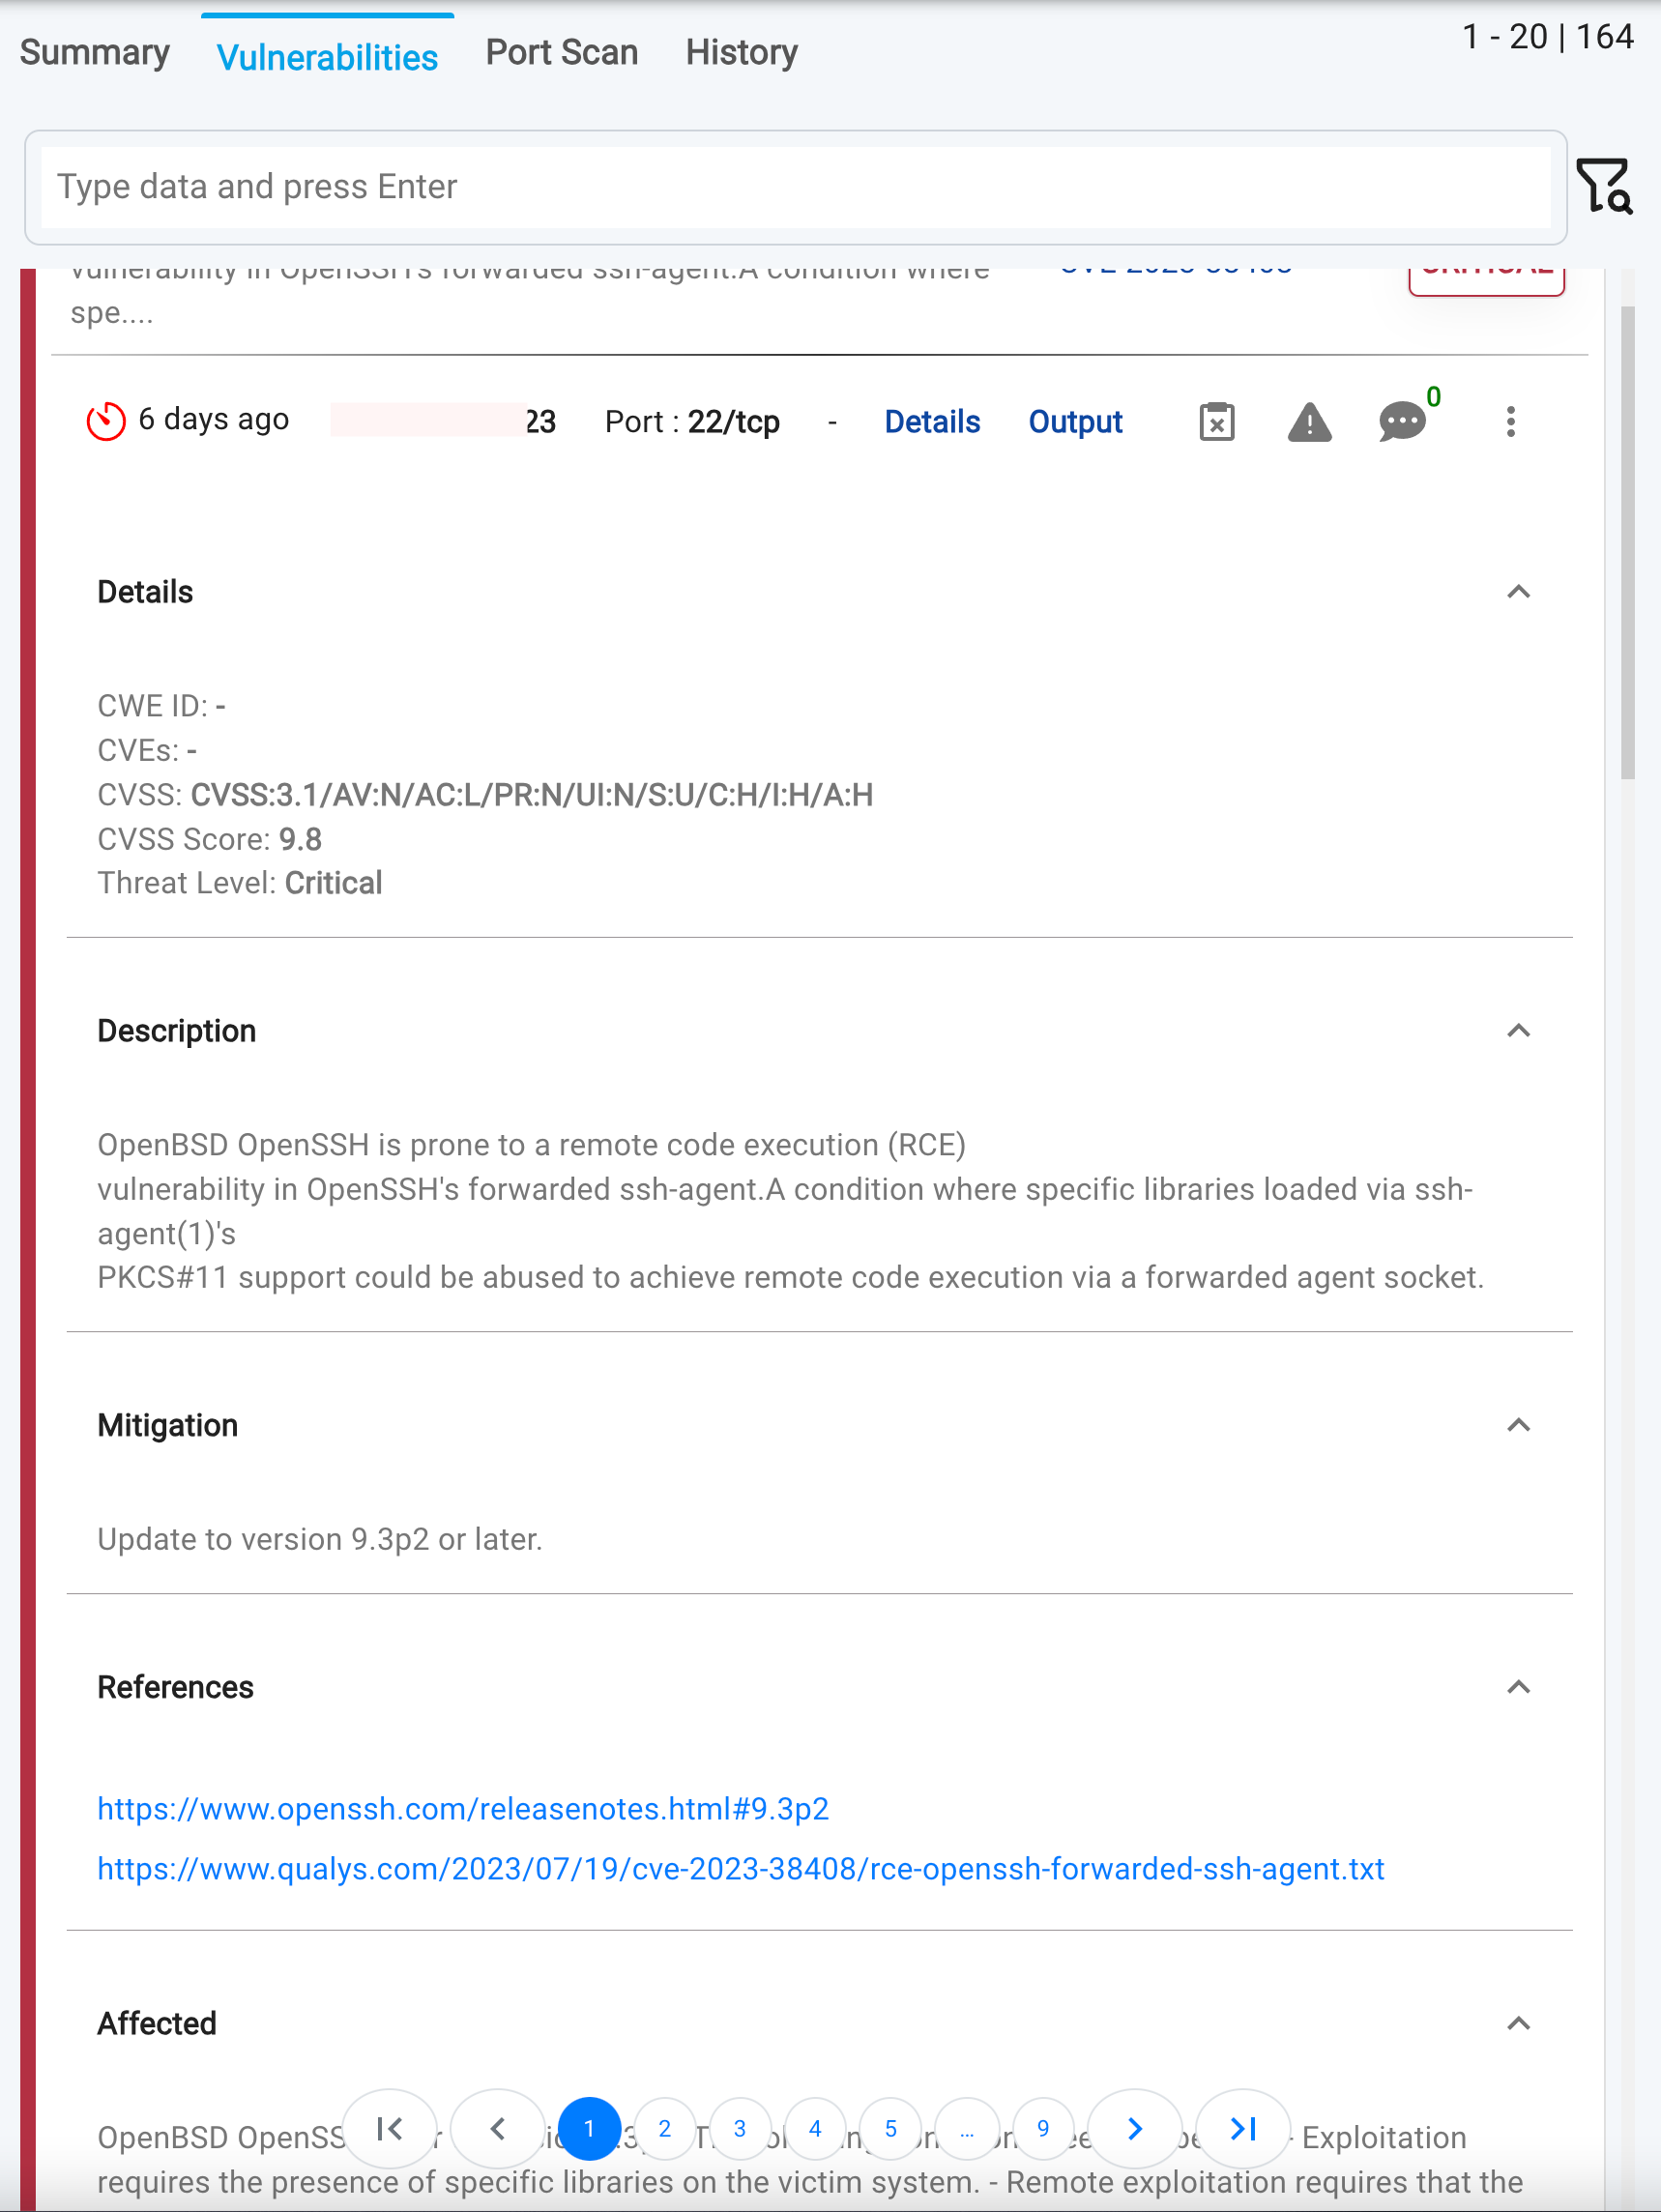
- To gain a deeper understanding of a vulnerability, click on the
Detailsbutton. This expands an accordion, revealing comprehensive information, including:- Affected Devices: List of devices impacted by the vulnerability
- Mitigation: Recommendations for remediation
- Description: Detailed explanation of the vulnerability
- Metrics:
- CVSS Vector string
- CVSS Score
- CWEs (Common Weakness Enumeration)
- Threat level
- Additional Information: Scanner-related details and other relevant data
To view a reference image of details of vulnerability, click here to expand.
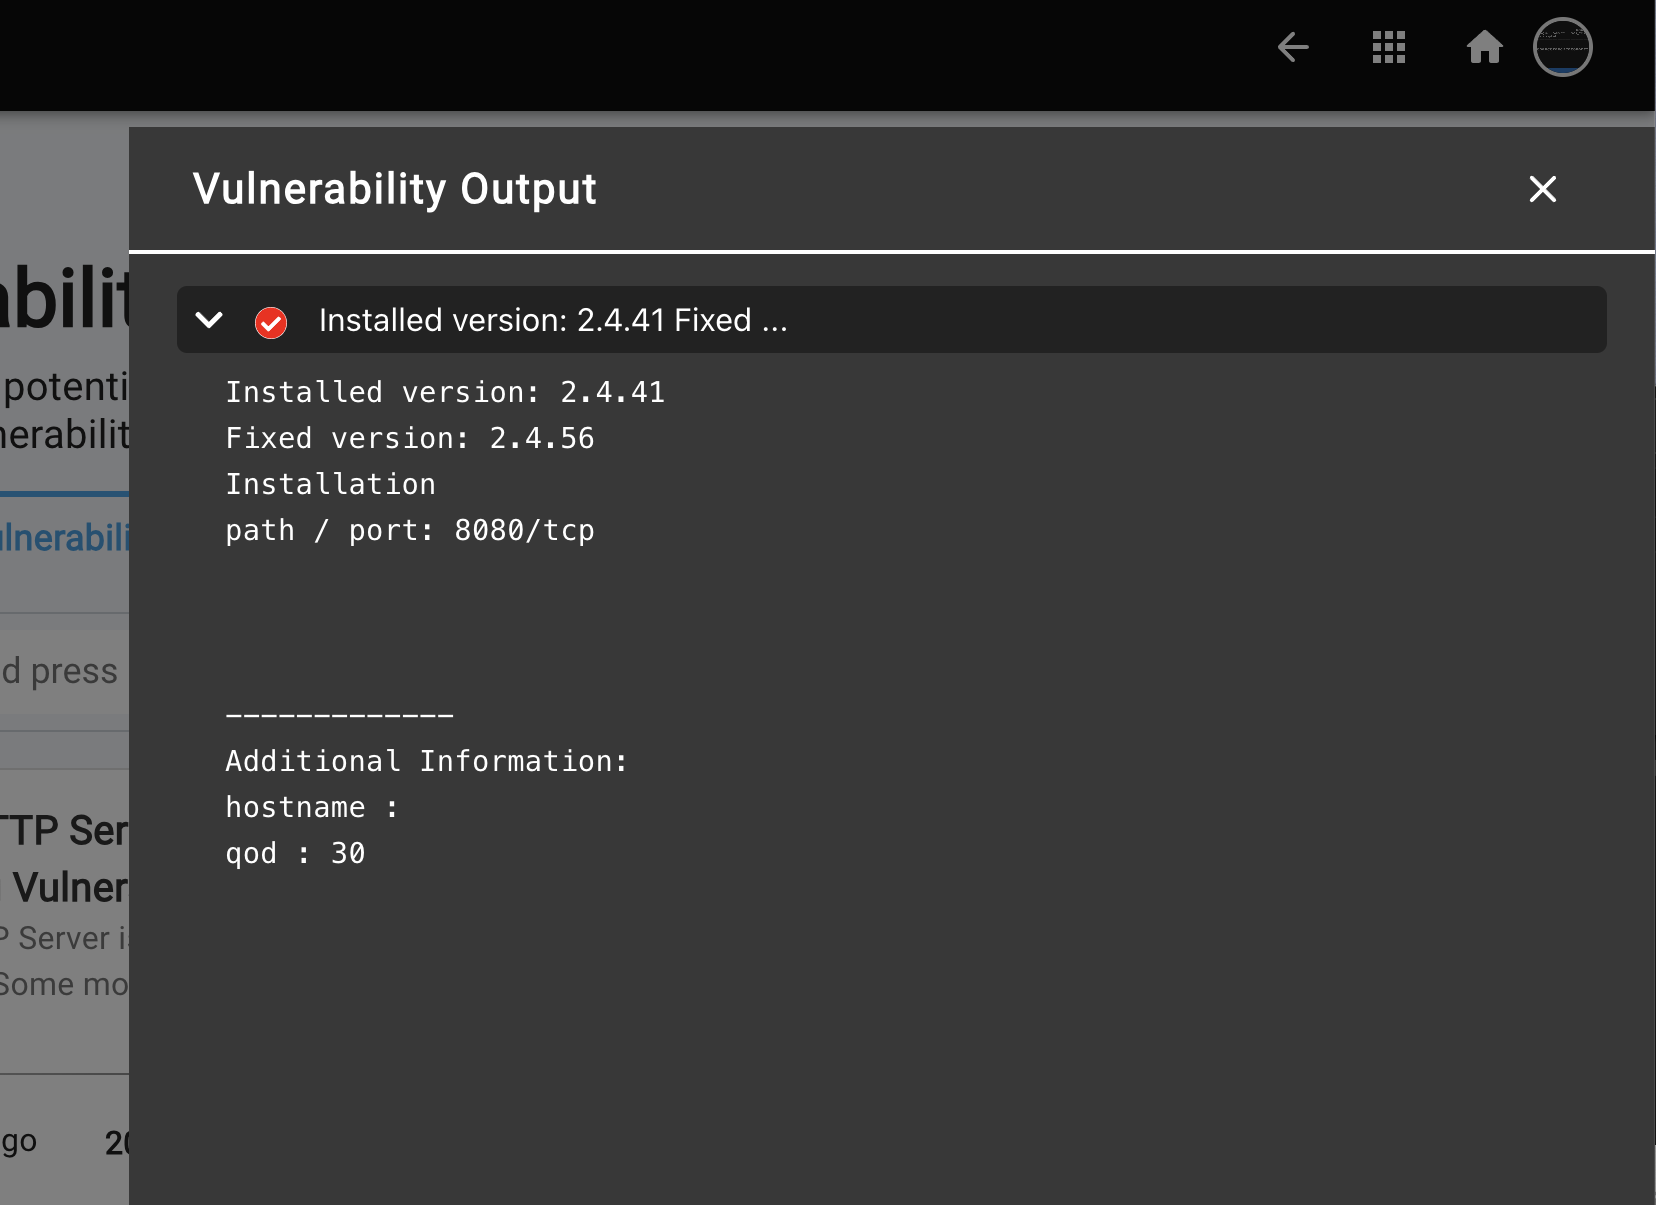
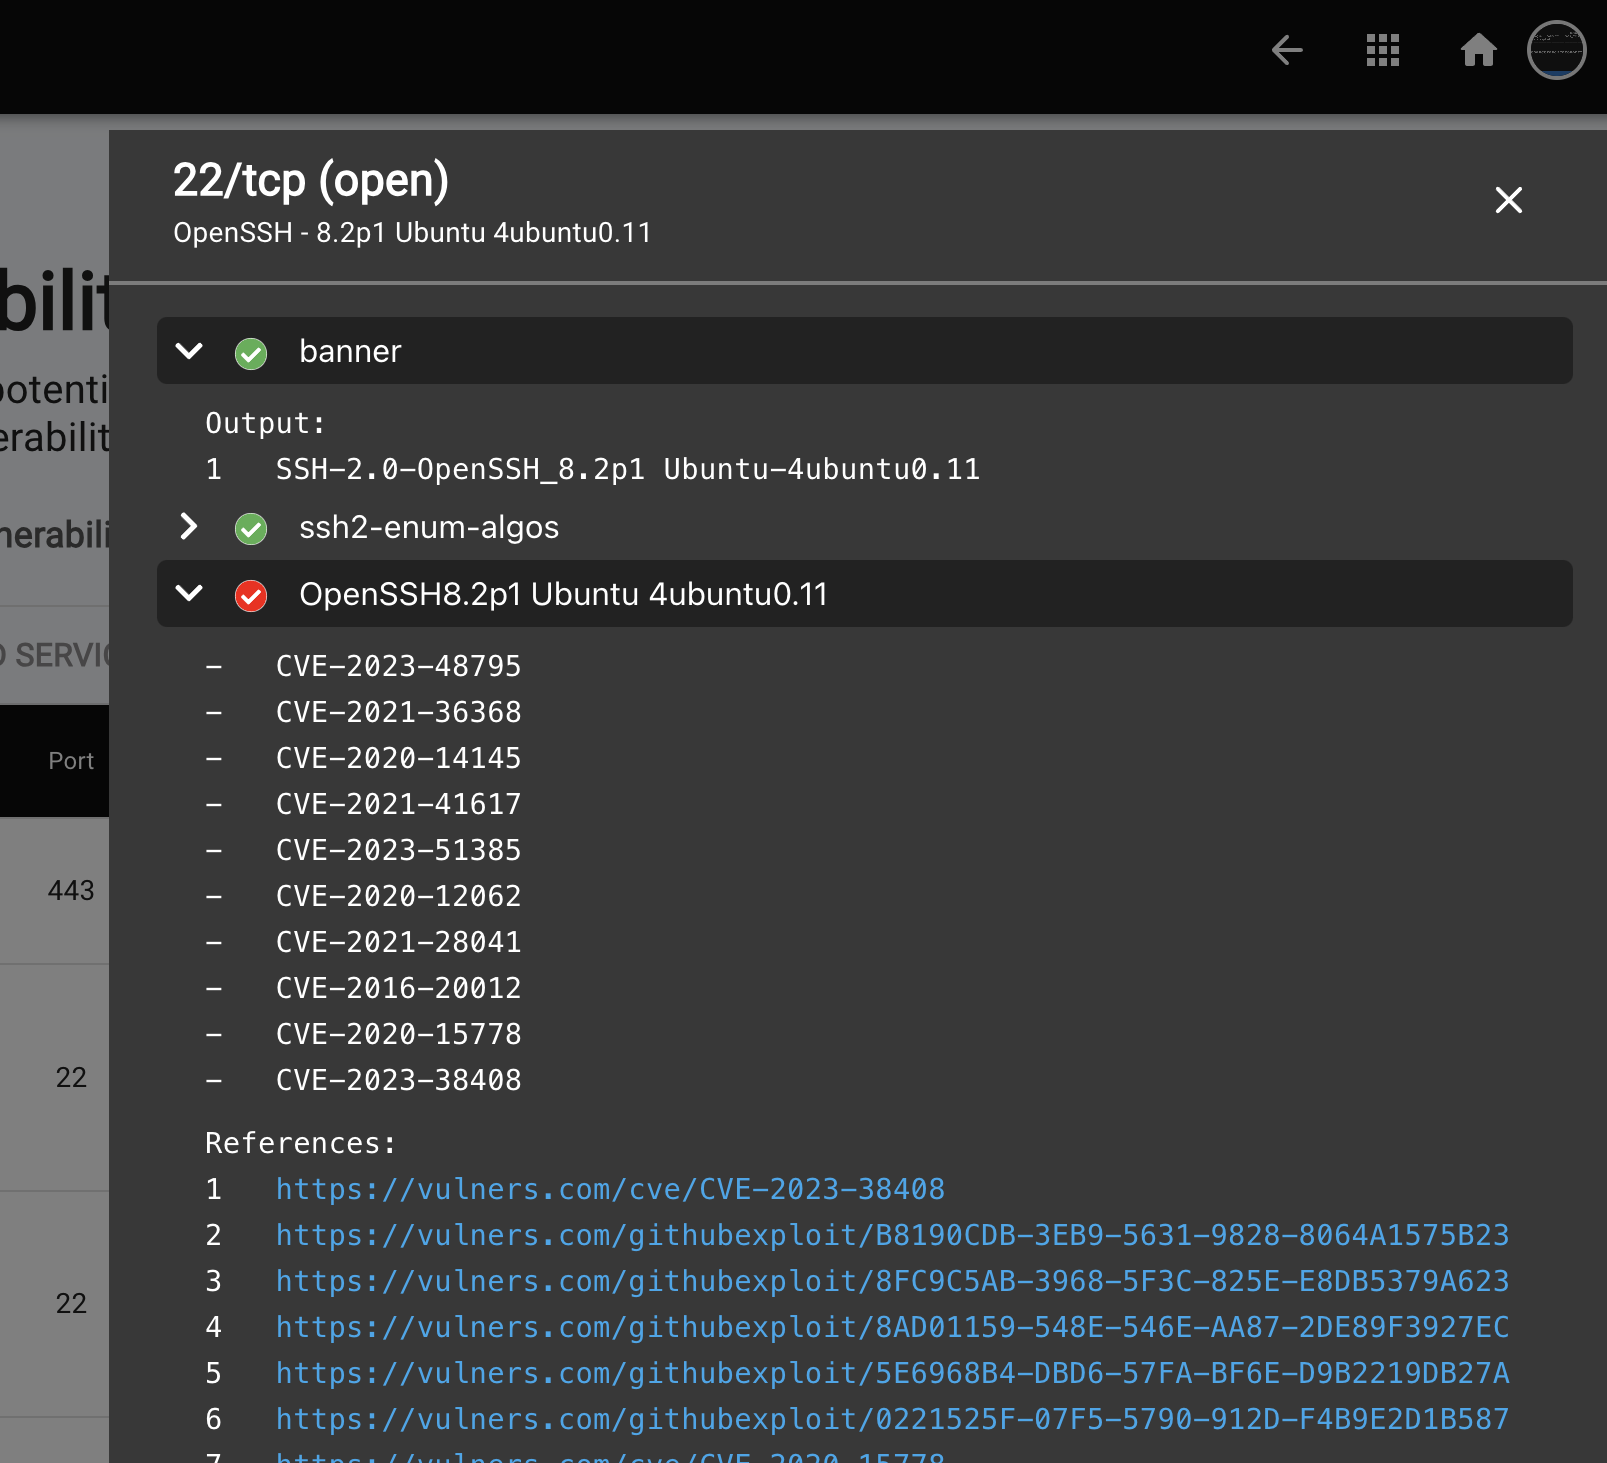
- To view the evidence supporting a detected vulnerability, click on the "Output" link. A slide-out panel will appear, displaying the detailed scan output that triggered the vulnerability mapping. Below is one of the sample output from scanner,
Installed version: 8.2p1
Fixed version: 9.3p2
Installation
path / port: 22/tcp


-------------
Additional Information:
hostname : ap-south-1.8c415d90c151-gitlab.traqez.com
qod : 30
To view a reference image of vulnerability evidence, click here to expand.
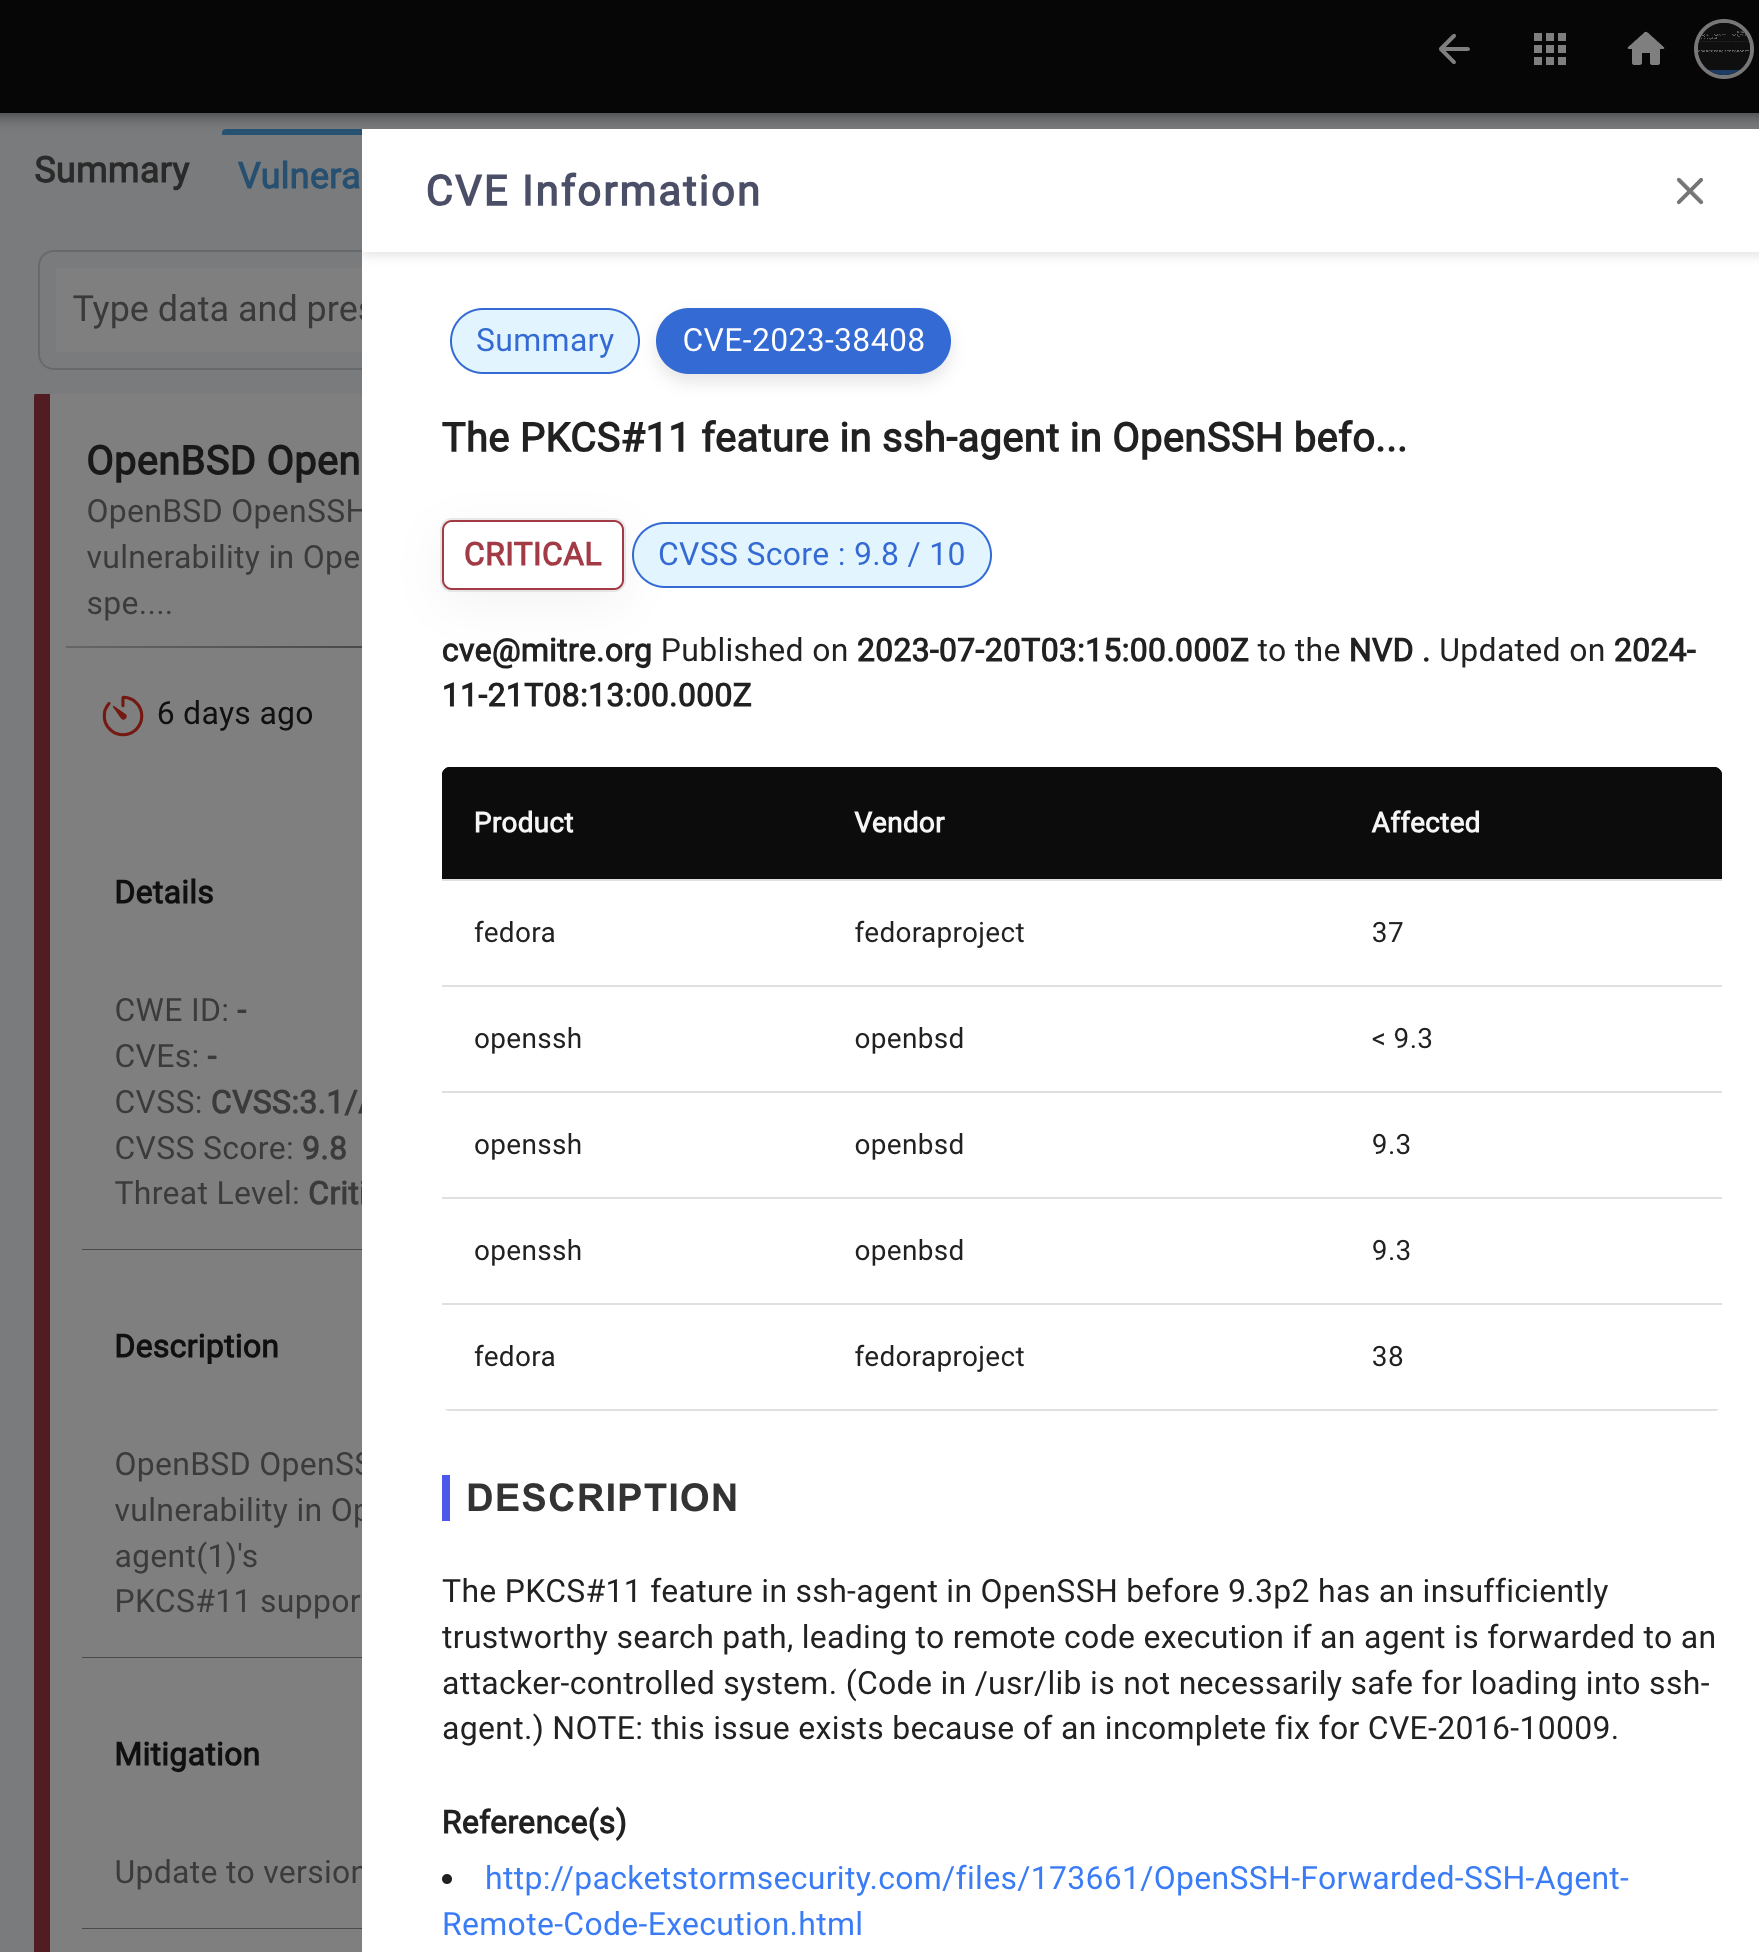
- You can access CVE details directly from the vulnerability results page. Simply click on the CVE values, which appear as links within the accordion. A slide-out panel will then appear, displaying the relevant CVE details.
To view a reference image of CVE details, click here to expand.
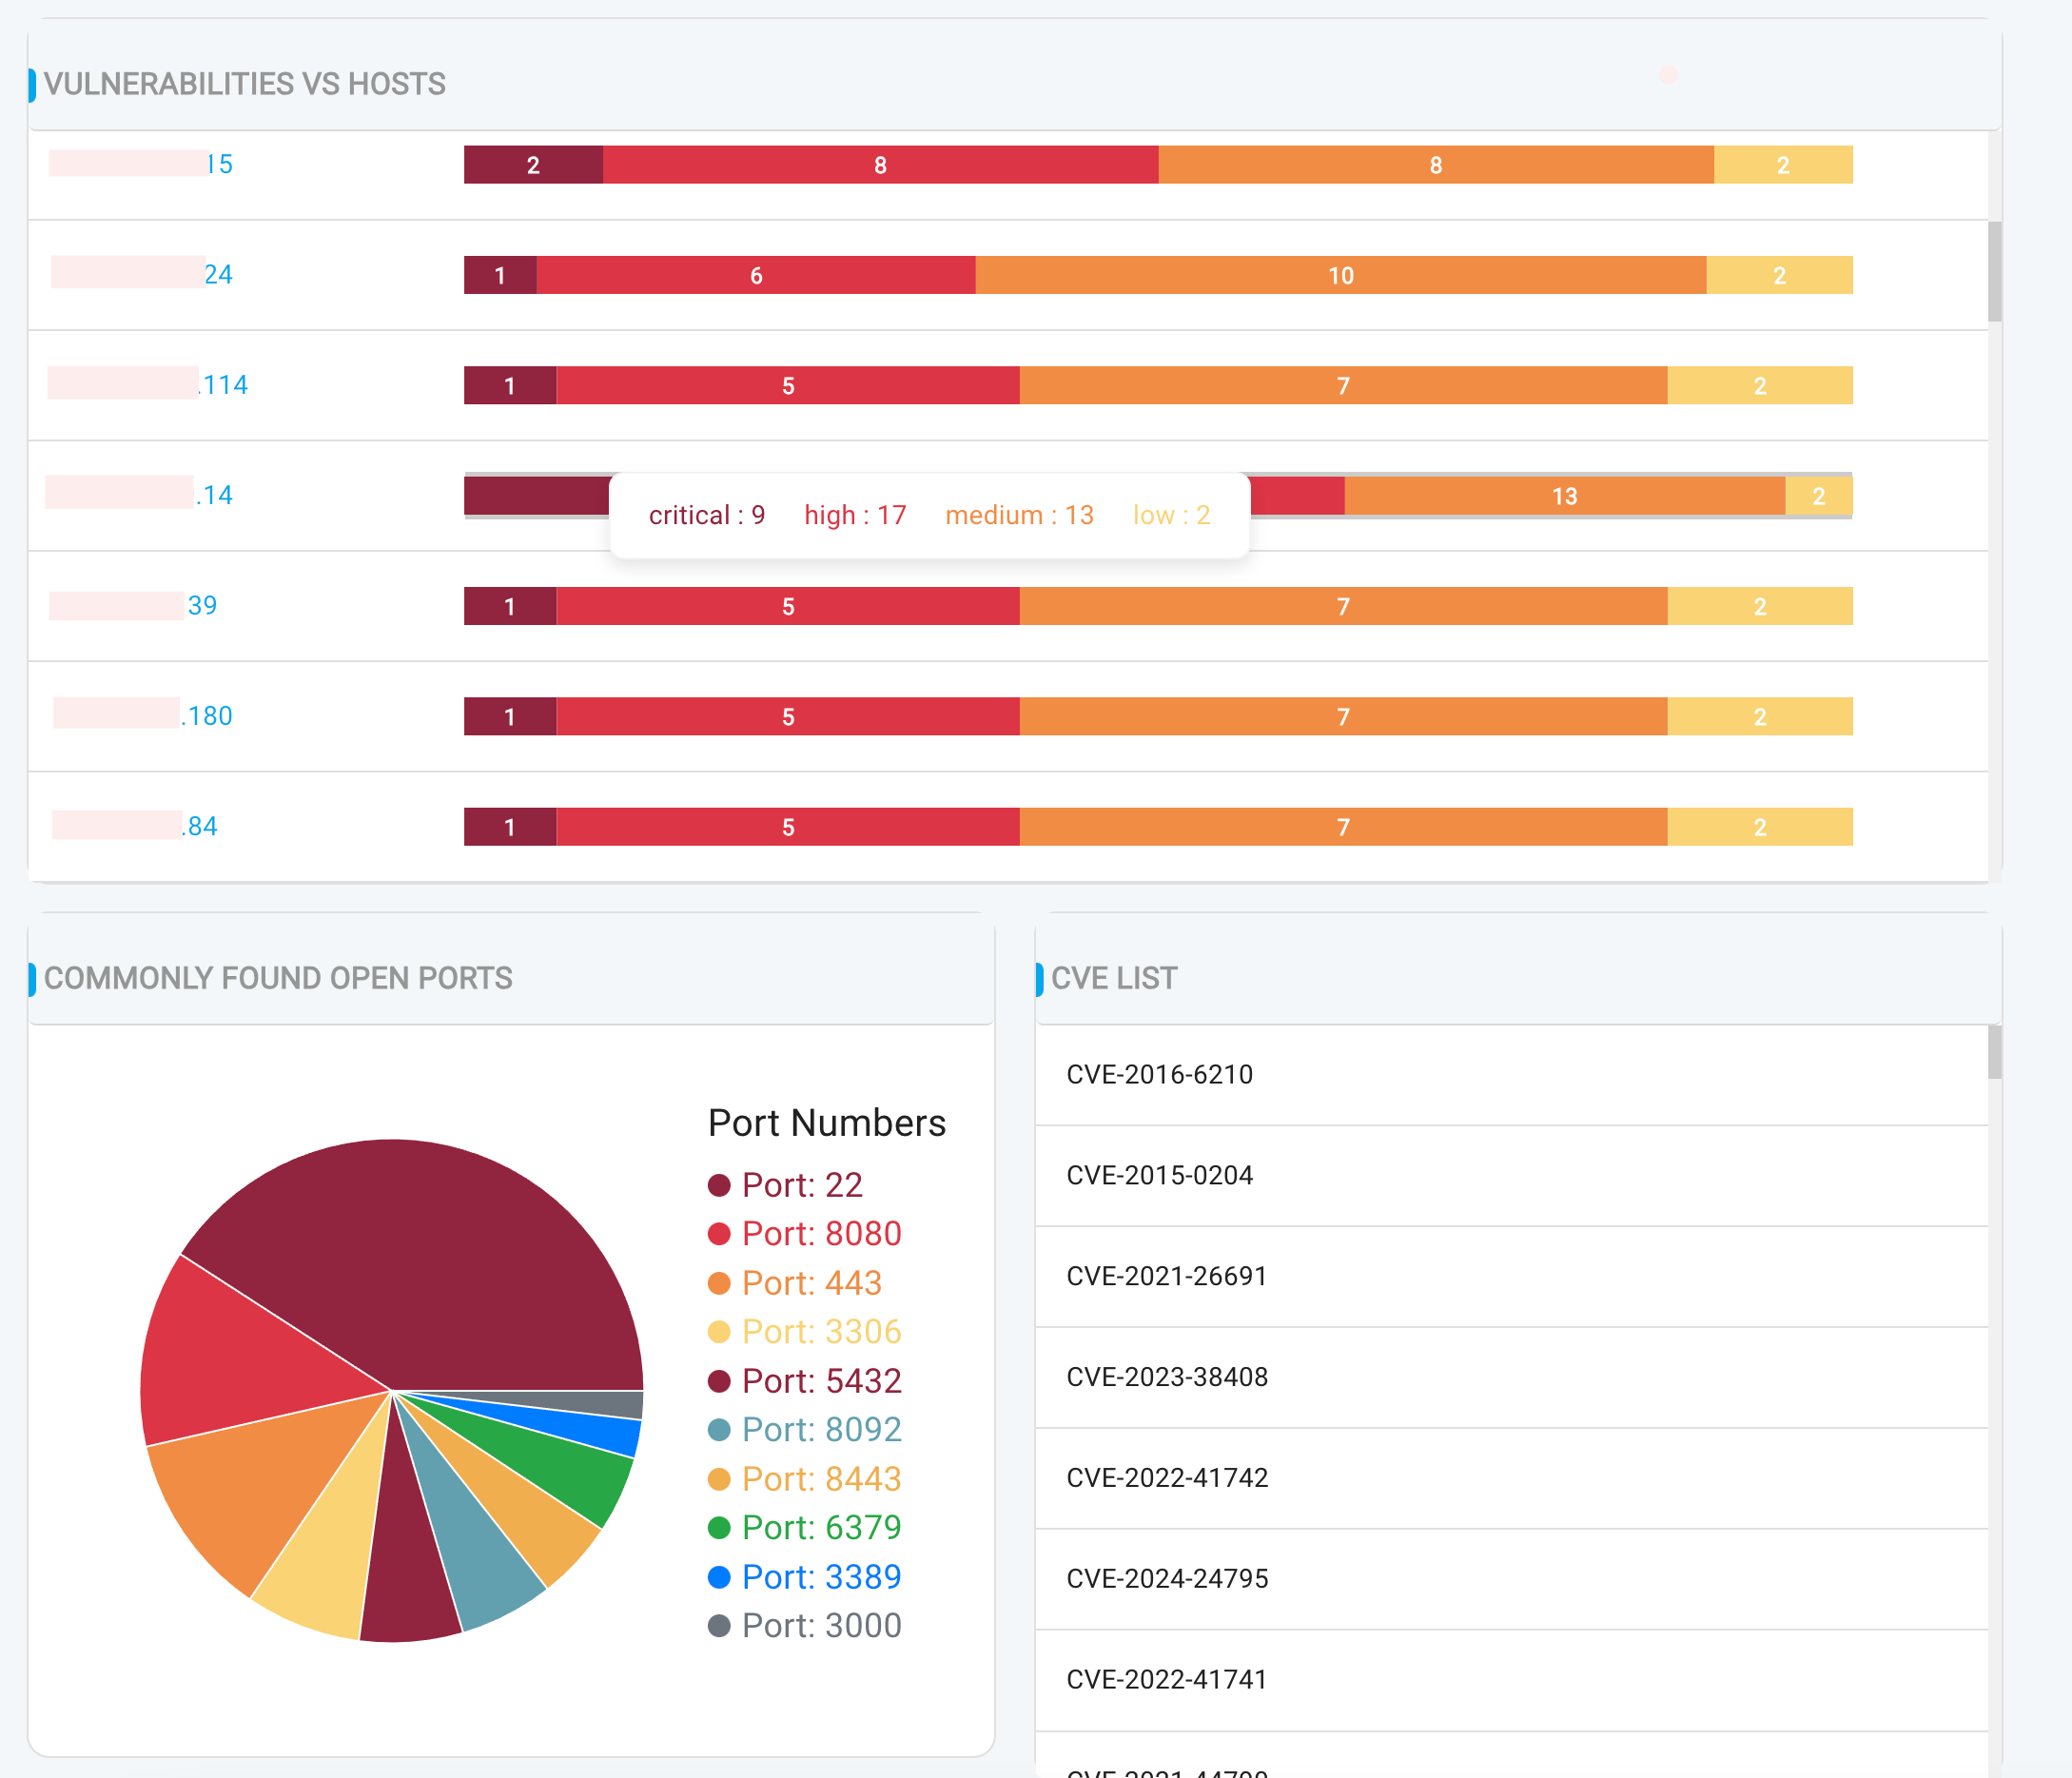
Summary Tab
- Aggregated results of all findings from all endpoints
- Vulnerability breakdown by severity:
- Critical
- High
- Medium
- Low
- Top Affected Hosts: A list of hosts with the most vulnerabilities, helping you prioritize remediation efforts
To view a reference image of Summary of vulnerabilities, click here to expand.
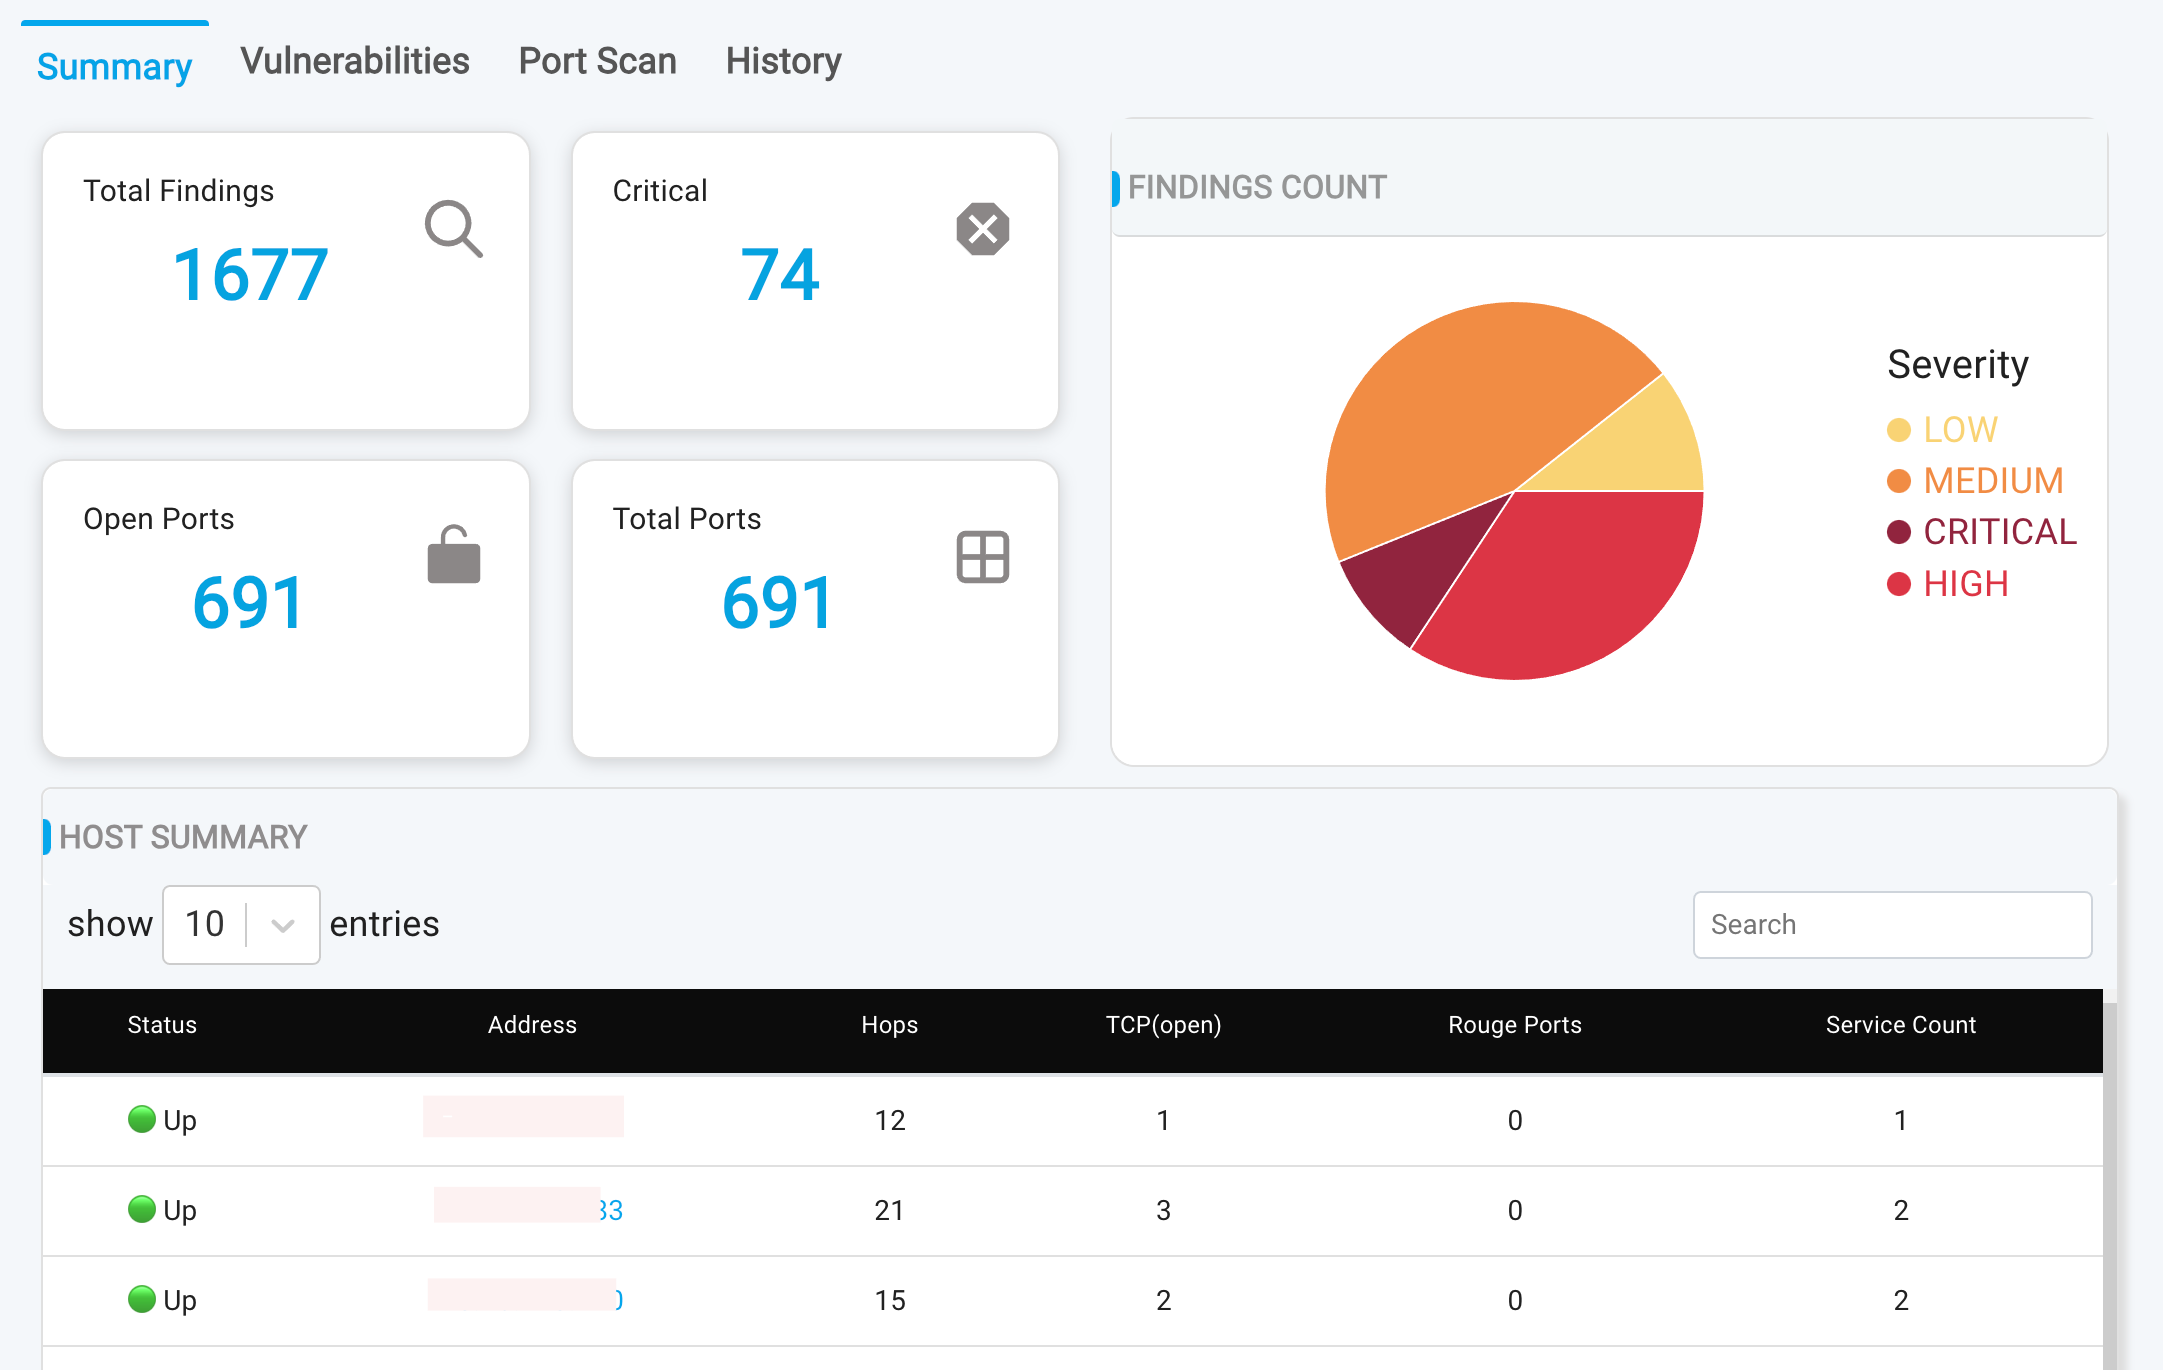
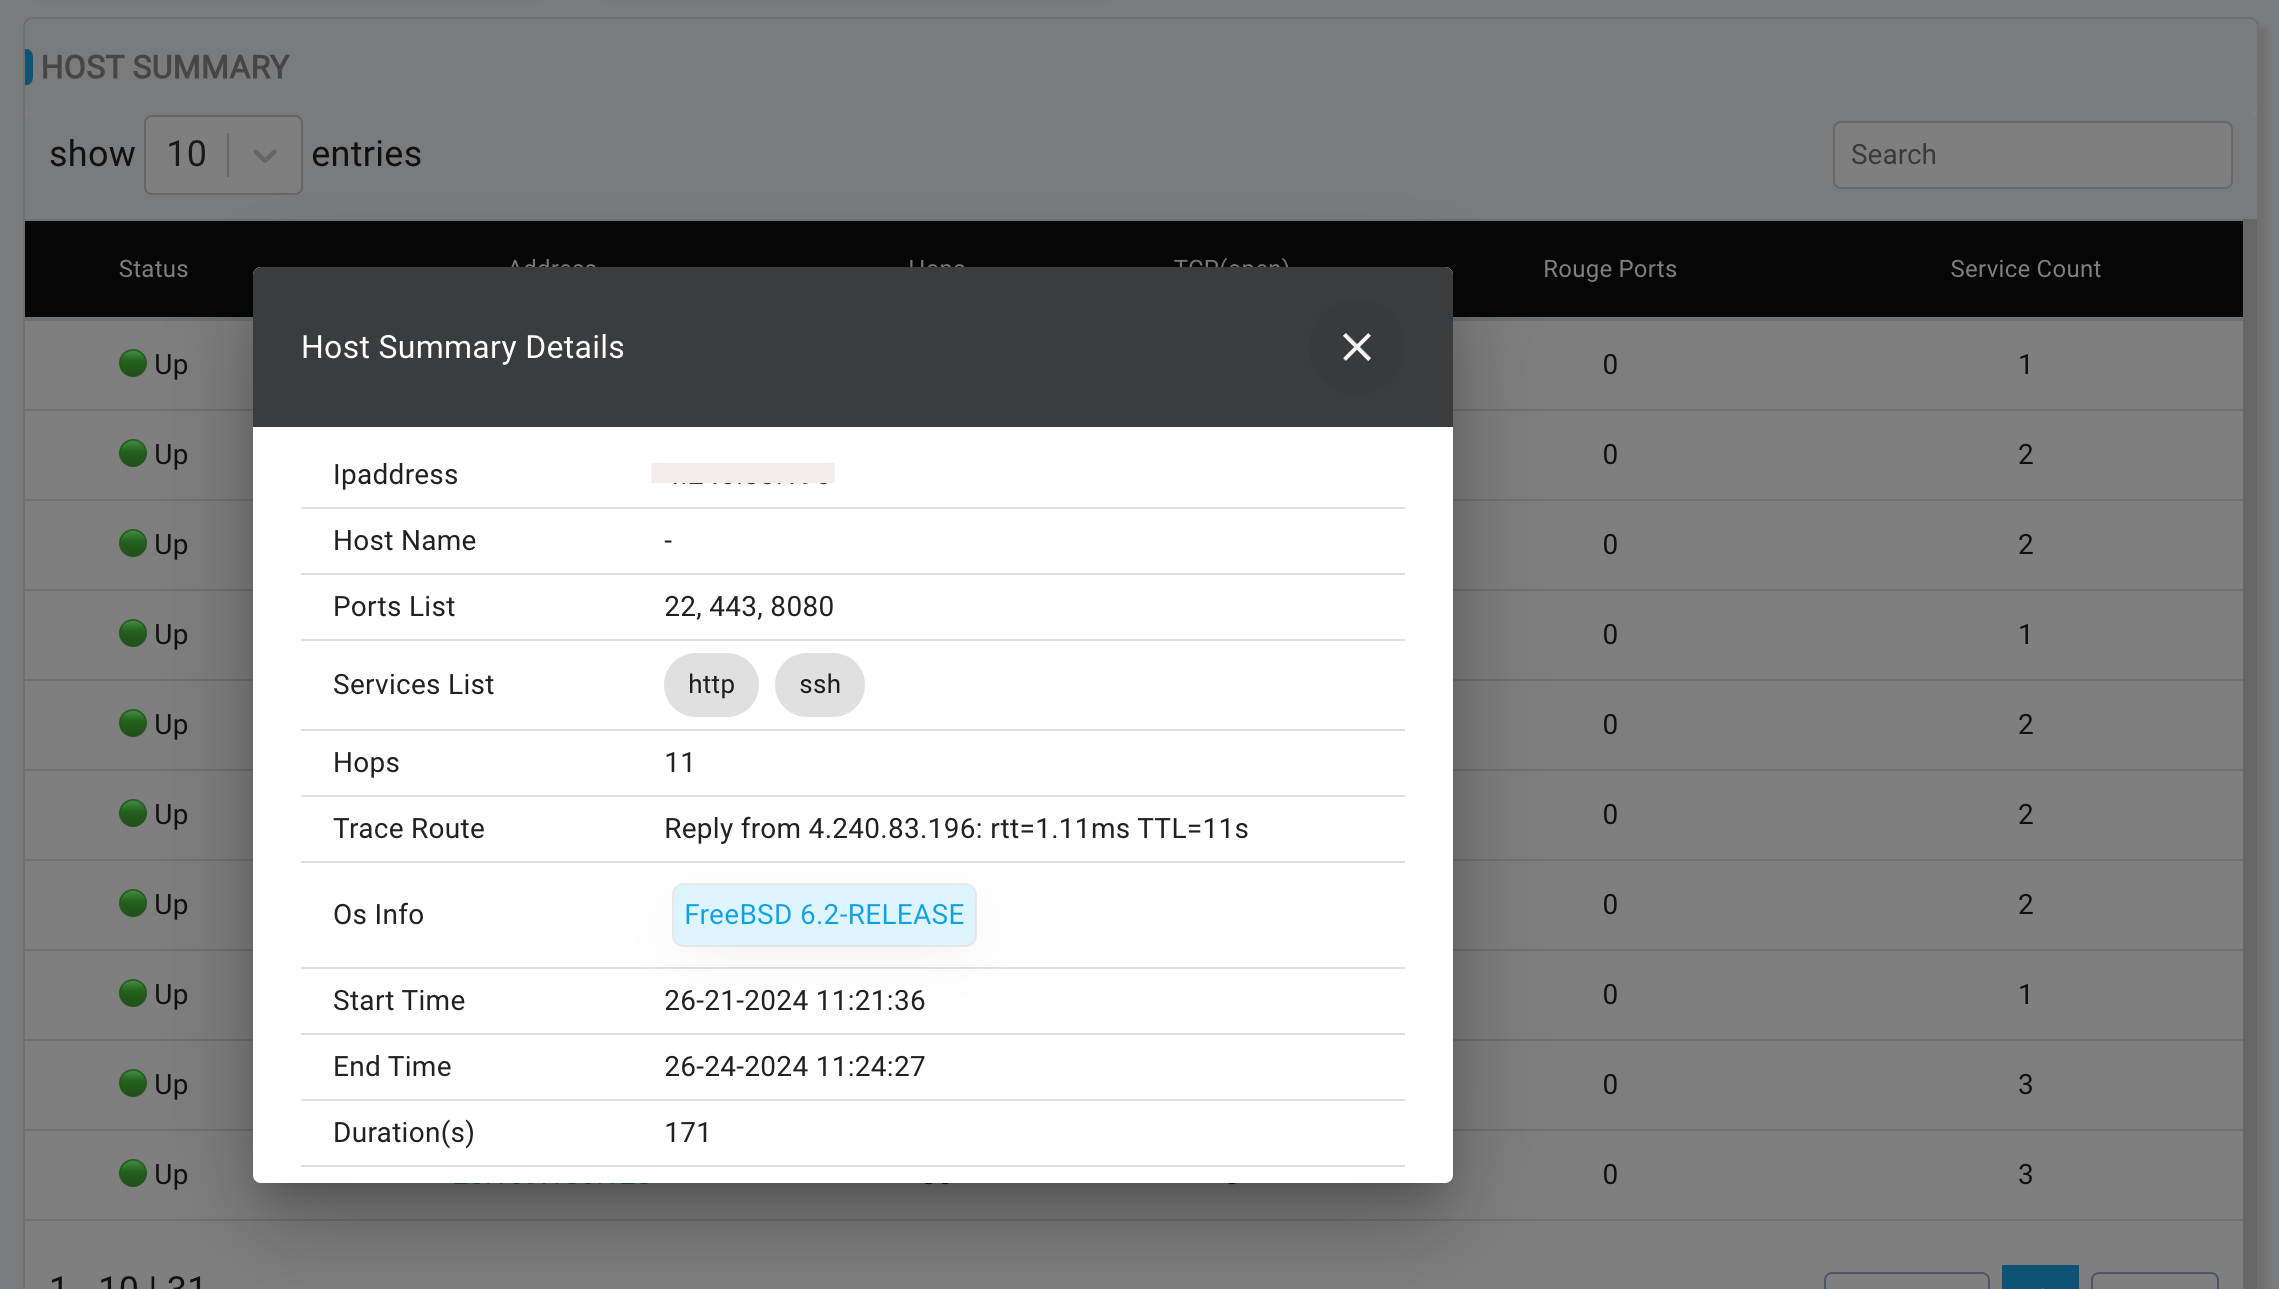
- Host Summary: This table shows all hosts which are up, number of ports opened, services running. On clicking the host, popup will appear which shows additional information about the host.
To view a reference image of Host summary popup, click here to expand.
Port Scan
The Port Scan tab offers a comprehensive overview of all hosts, including: Open ports and associated services and Service version numbers.
To view a reference image of port scan, click here to expand.
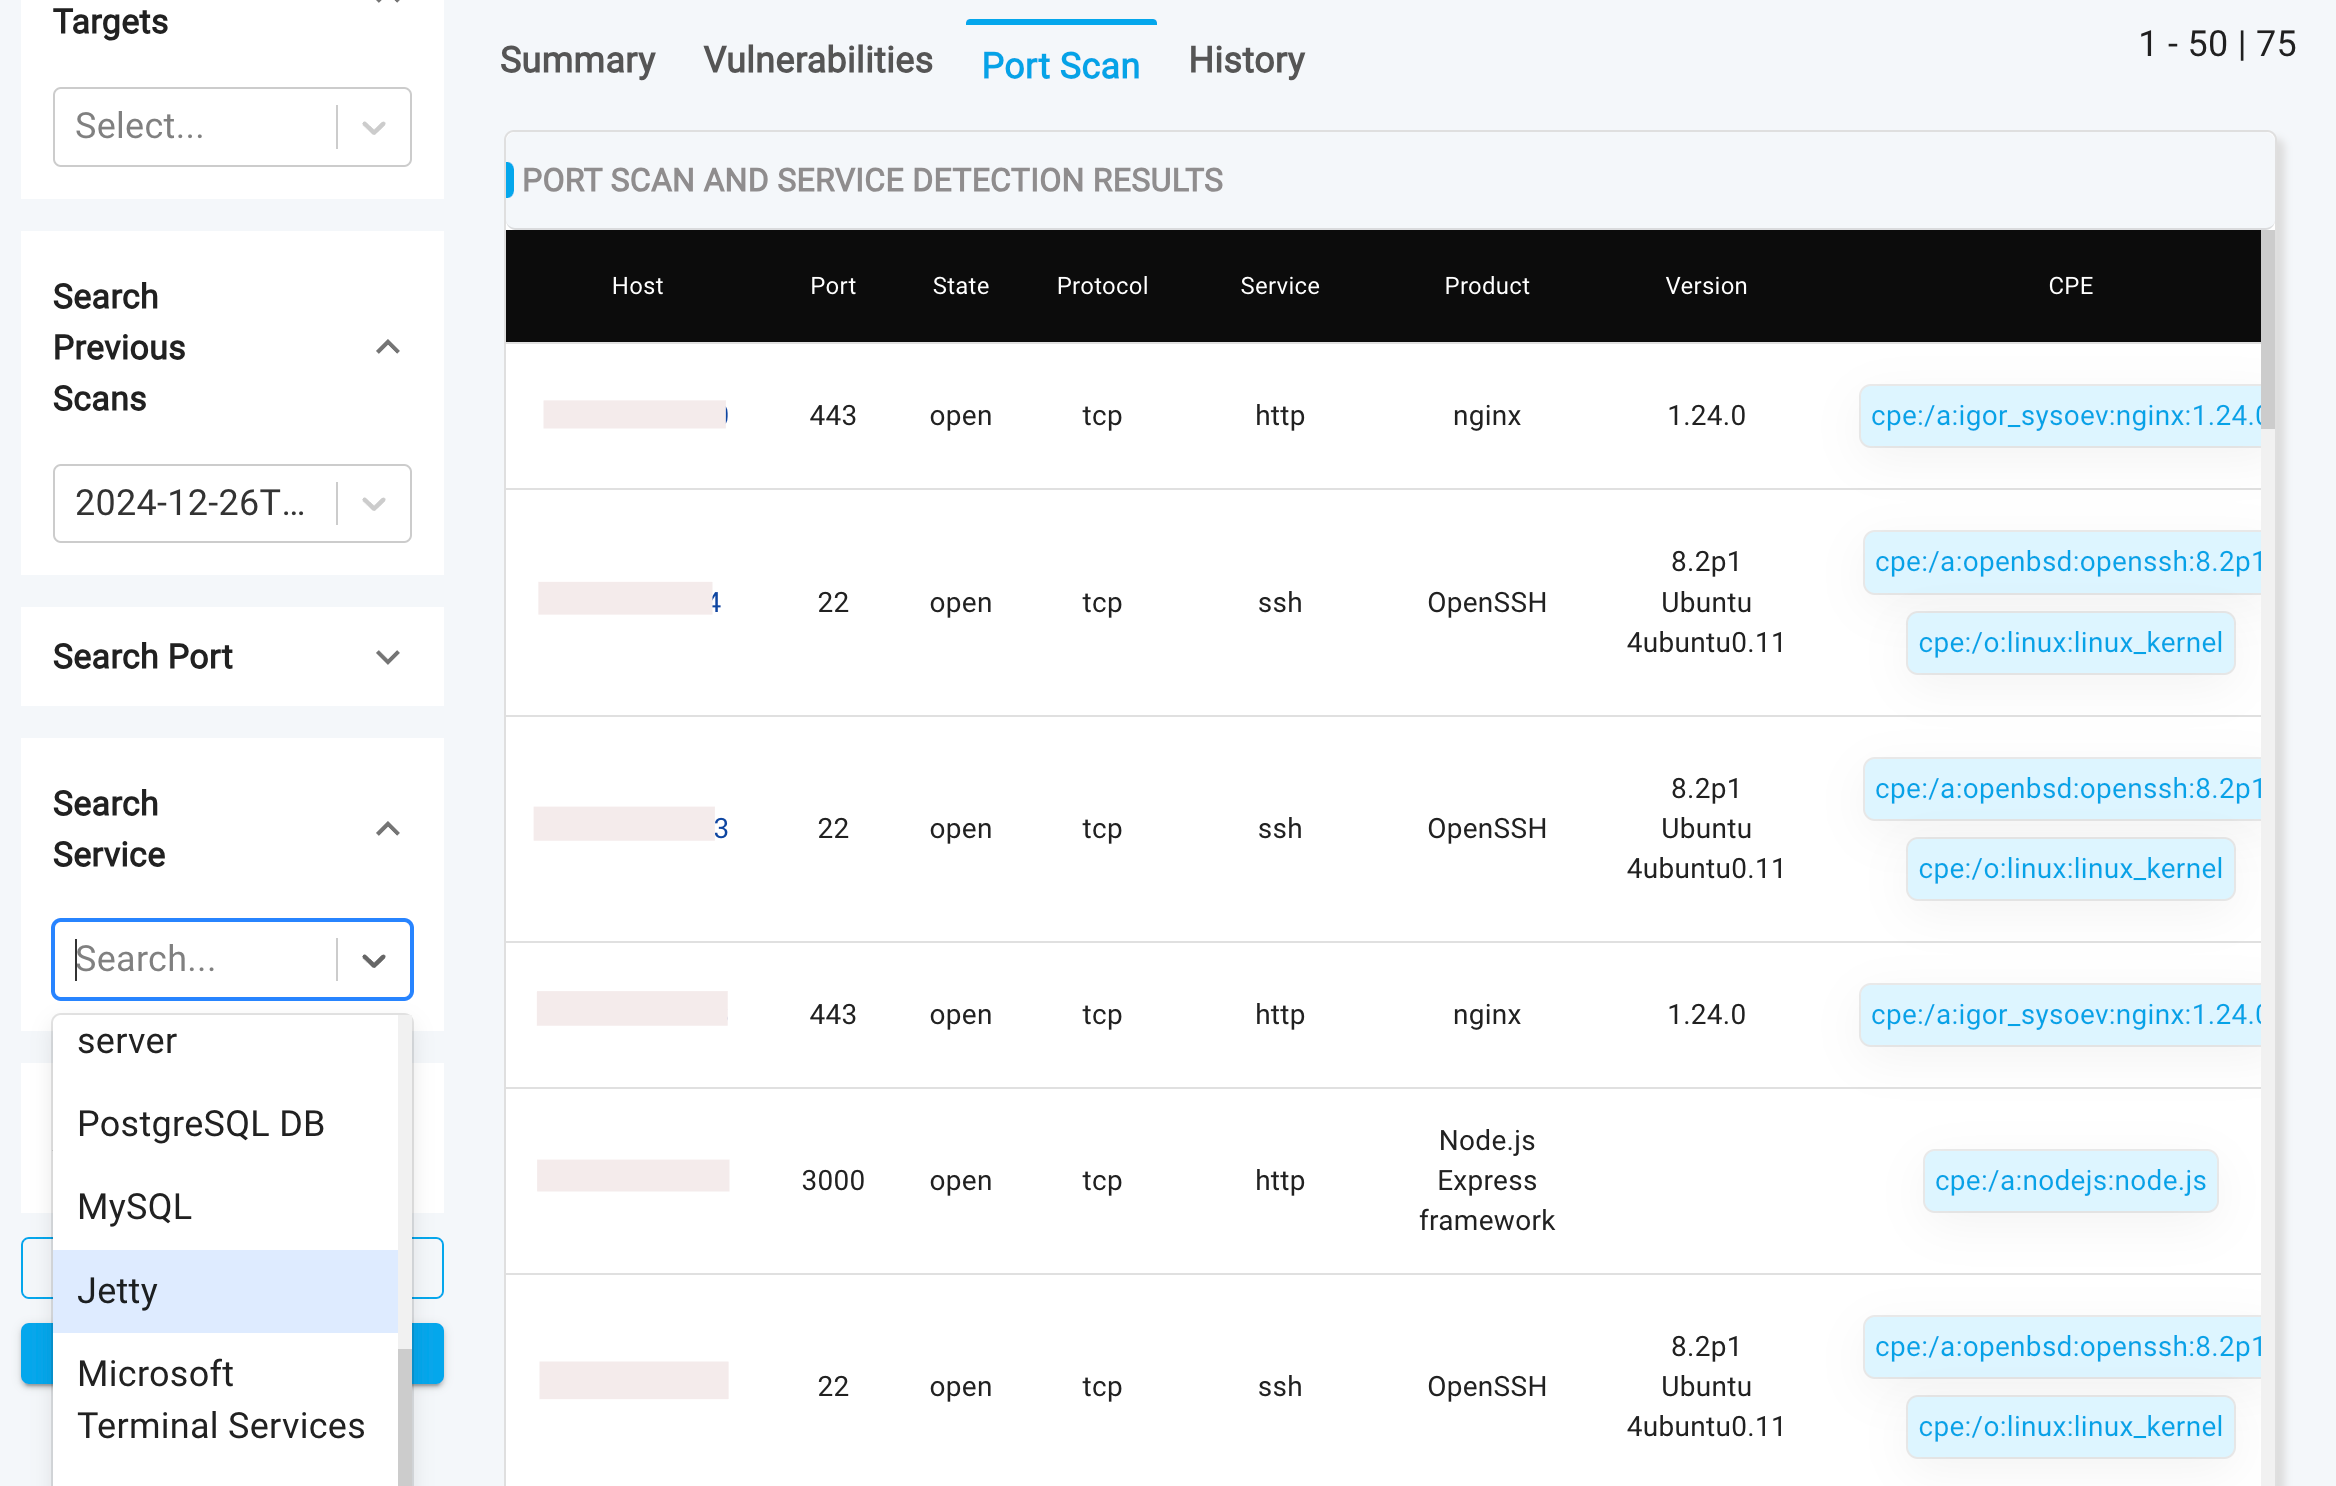
- Multiple search filter's can be applied, to filter based on ports/ services.
- This table enables you to quickly identify and address potential security risks, such as critical ports that may have been accidentally left open, including sensitive services like database ports.
- This table also facilitates the detection of unknown or rogue services that may be running without your knowledge or authorization, enabling you to identify and investigate suspicious activity.
- Clicking on a host opens a slide-out panel, providing detailed scan output from the port and service enumeration. This additional information helps you:
- Understand the services running on each host
- Identify potentially unnecessary services for closure
To view a reference image of port scan output, click here to expand.
History Tab
The History Tab provides unparalleled visibility into your organization's vulnerability management, enabling you to track the discovery and mitigation of vulnerabilities over time based on continuous scanning policies.
To view a reference image of history of scans, click here to expand.
- Complete Scan Traceability: Maintain a comprehensive record of all your scans, allowing you to:
- Access previous scan results at any time
- Track vulnerability discovery and mitigation
- Simplify audit processes with detailed scan history
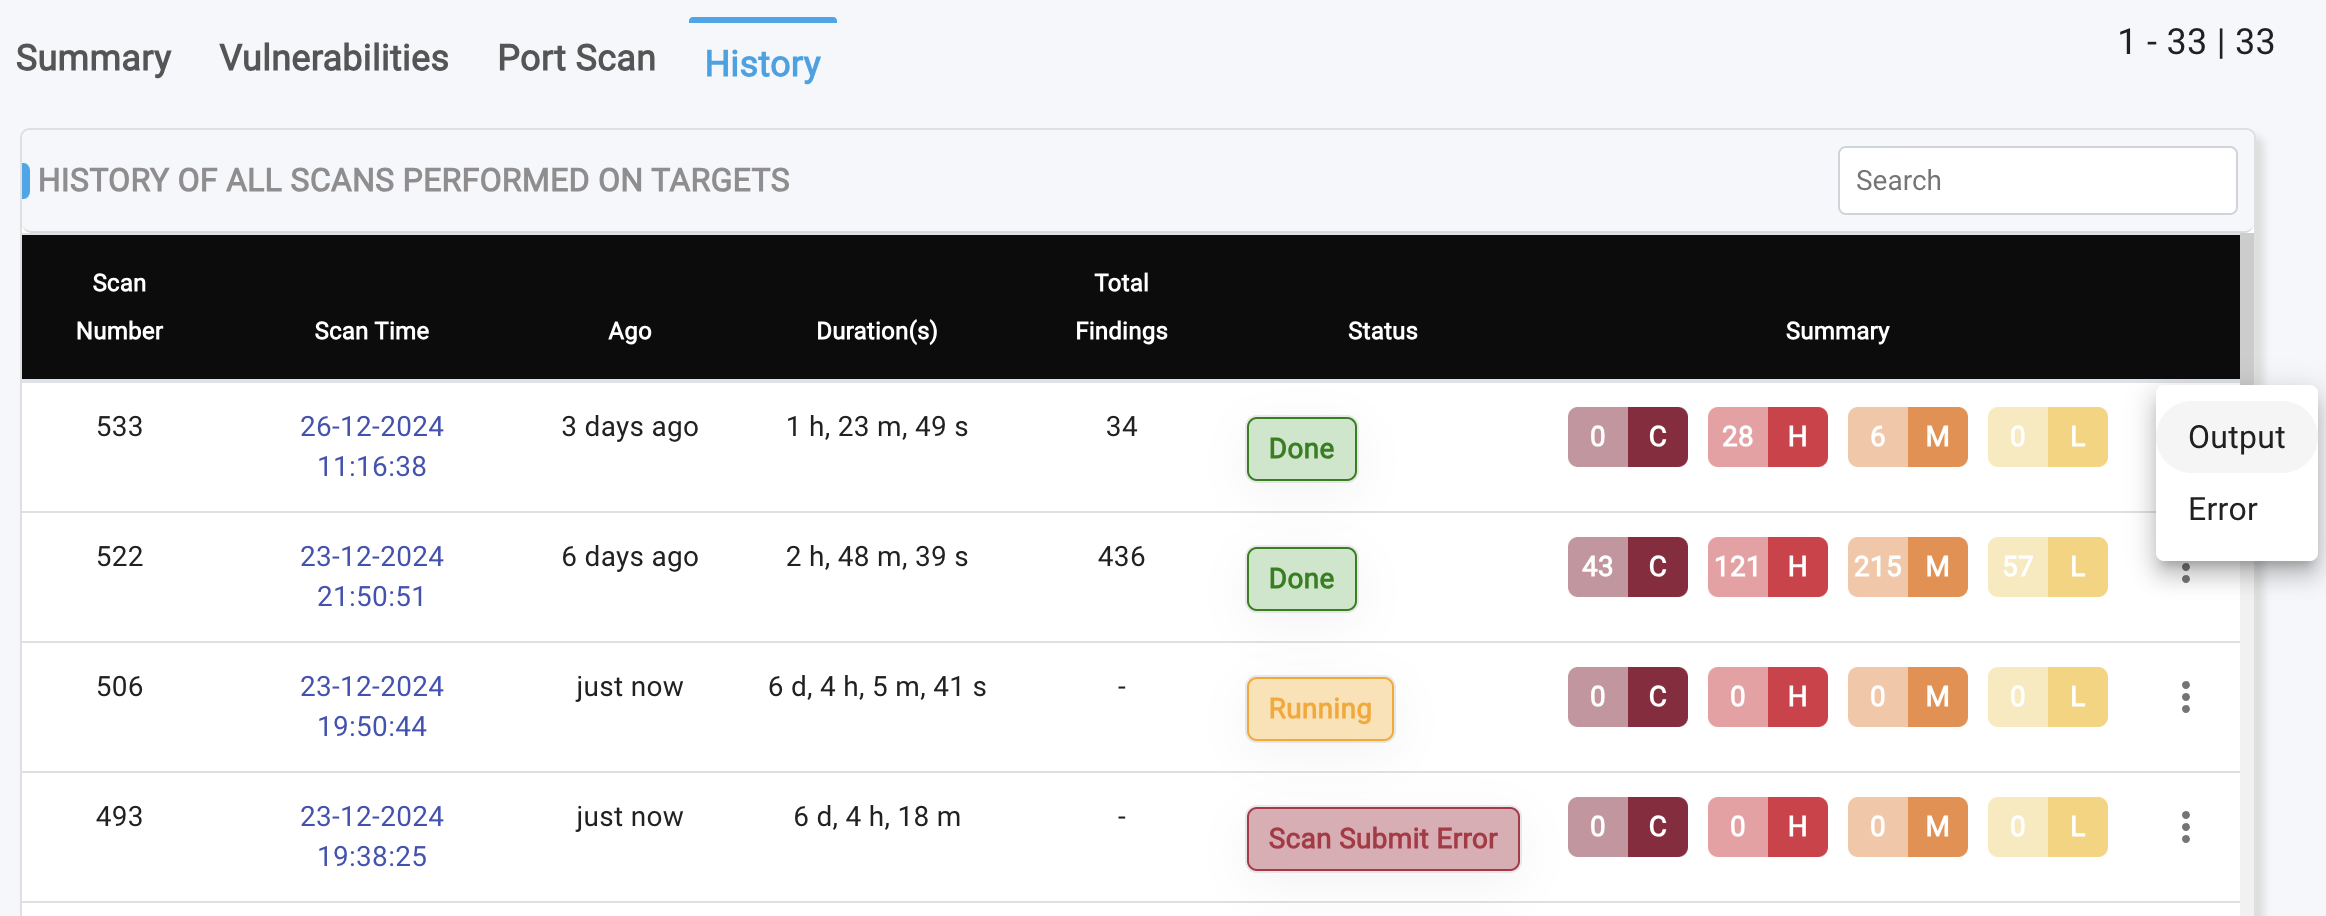
- Scan History Table: The scan history table provides a detailed overview of past scans, including:
- Scan Time: Timestamp of the scan
- Duration: Length of the scan
- Status: Outcome of the scan (e.g., completed, failed)
- Summary of Findings: Brief overview of vulnerabilities discovered
- Clicking on the triple dots reveals two options:
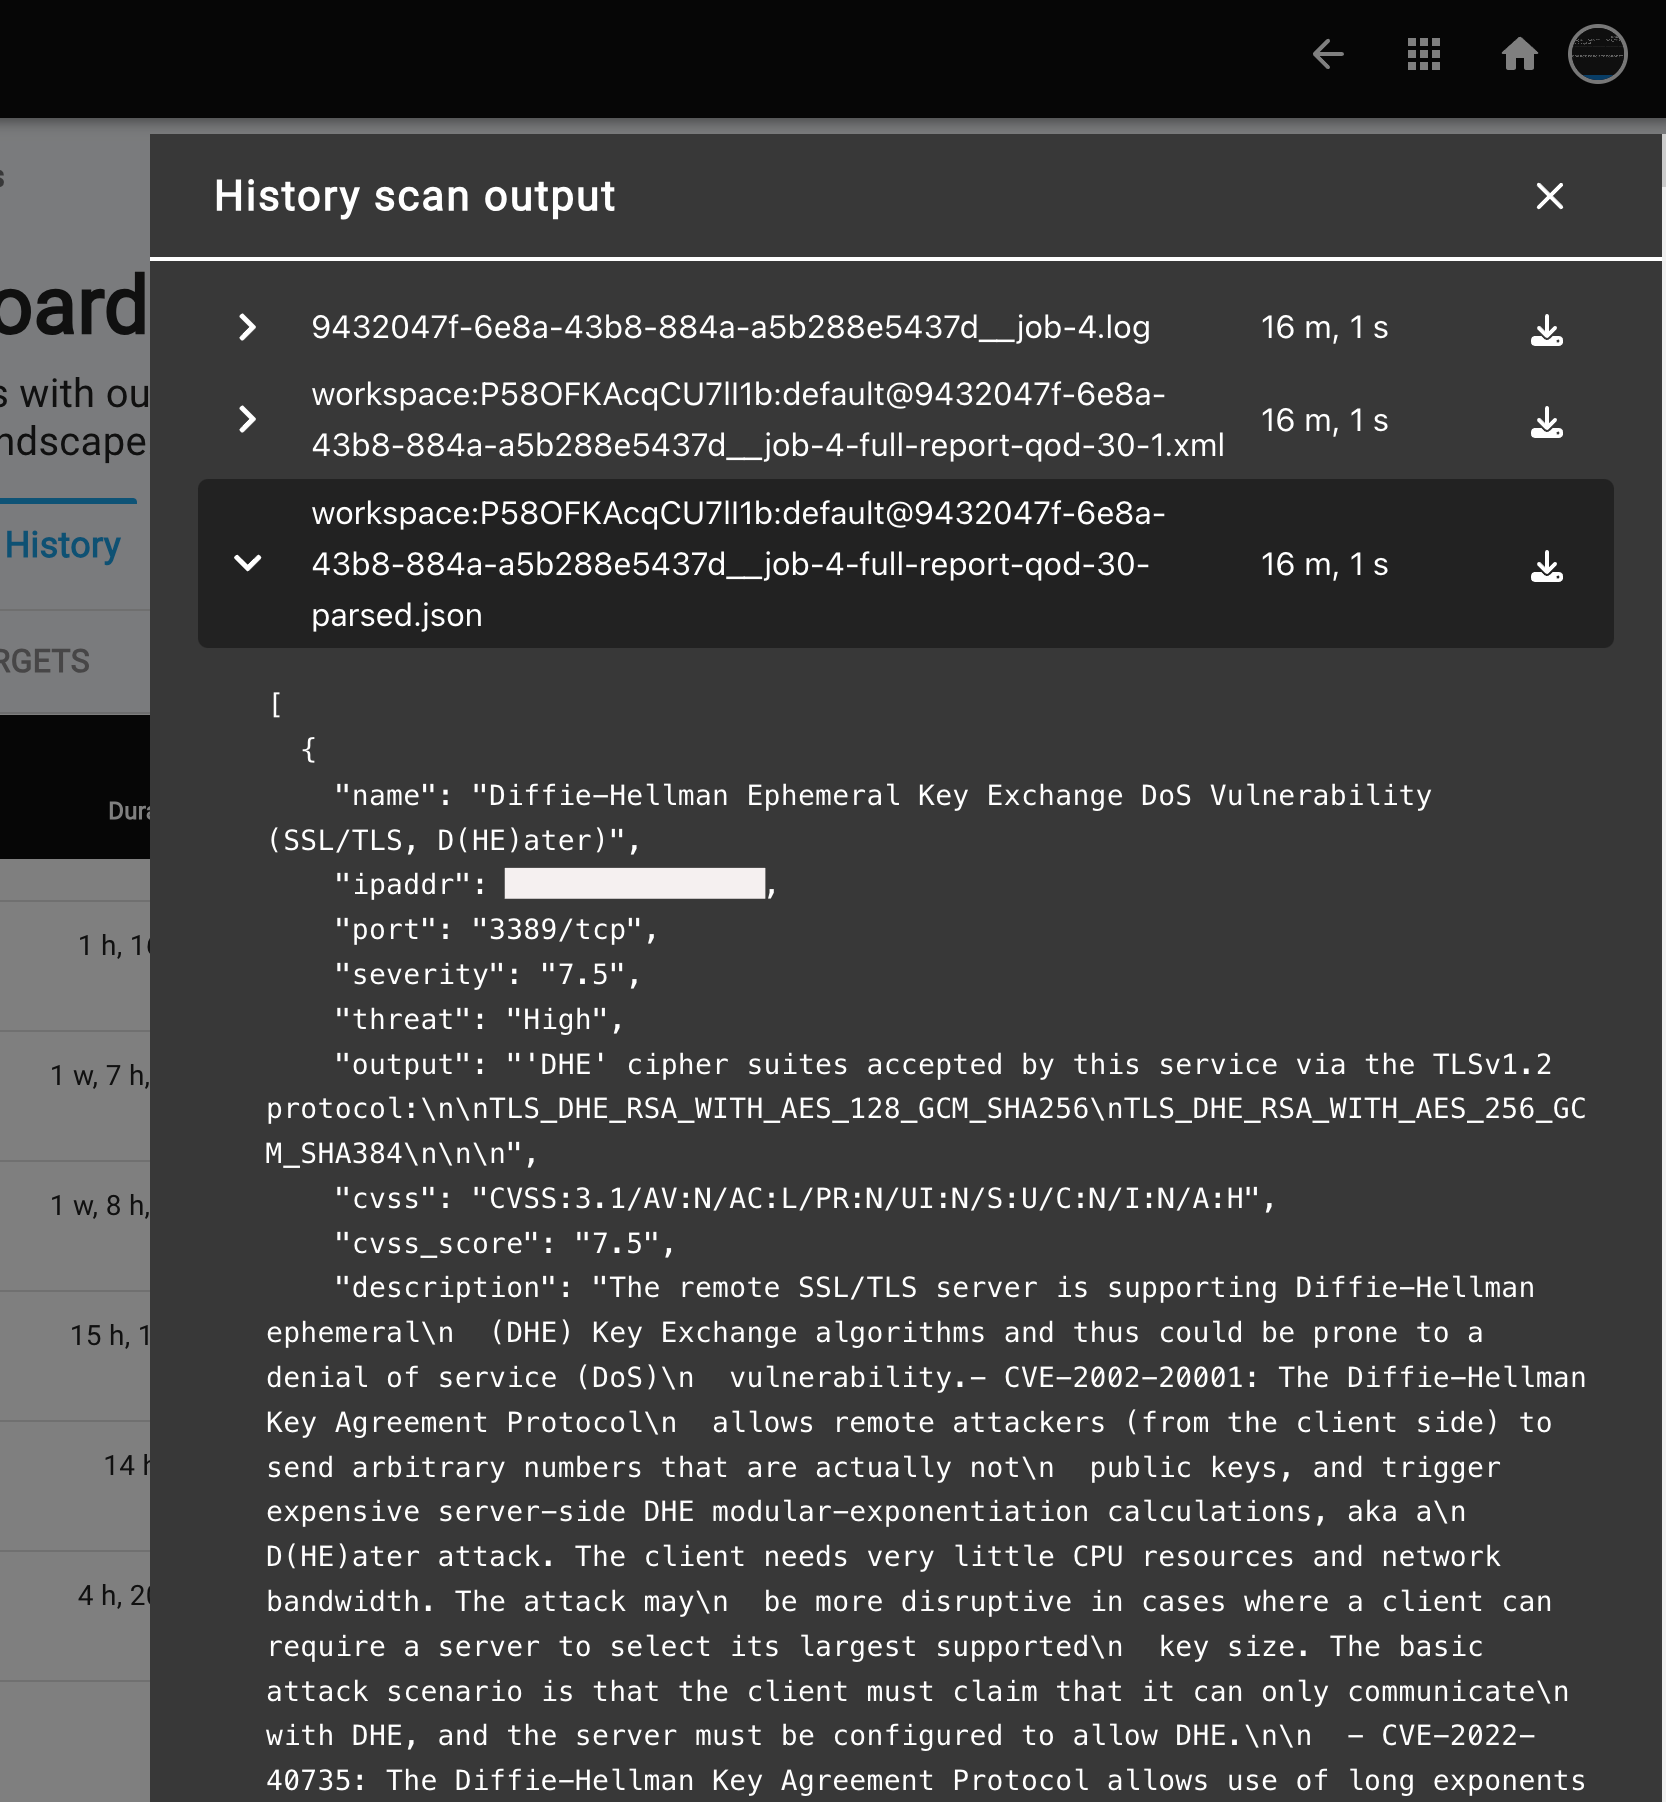
ArtifactsandErrors. - The
Errorsoption displays any scan-related errors to facilitate troubleshooting, while theArtifactsoption provides access to complete scan logs in raw data format, including XML, JSON, HTML, and .log files generated by the scanners.
To view a reference image of scan artifacts, click here to expand.
- Clicking on any Scan Time value allows you to revisit the corresponding scan results, automatically redirecting you to the Vulnerabilities tab for in-depth analysis.
Additional Information
- The sidebar search (present left side) filters enable swift and precise refinement of your results, streamlining your analysis process.
- Utilize the robust search functionality to filter results based on various criteria, including:
- Device(s)
- Previous scan results
- Severity
- CVSS Score
- Issue status
- Mitigation
- Specific vulnerability data and keywords
- Located at the top right, the
Go to Scans / <Current Scan Name>link allows you to navigate back to the list of all created scans with a single click.
To view a reference image of "Go back to scan's page hyperlink", click here to expand.
Deleting Scan
- The Scan can be deleted by
Selecting the three vertical dots(also called asMore OptionsorVertical Ellipsis). A dropdown menu will appear; select "Delete" to remove the scan.
To view a reference image of deleting a single scan, click here to expand.
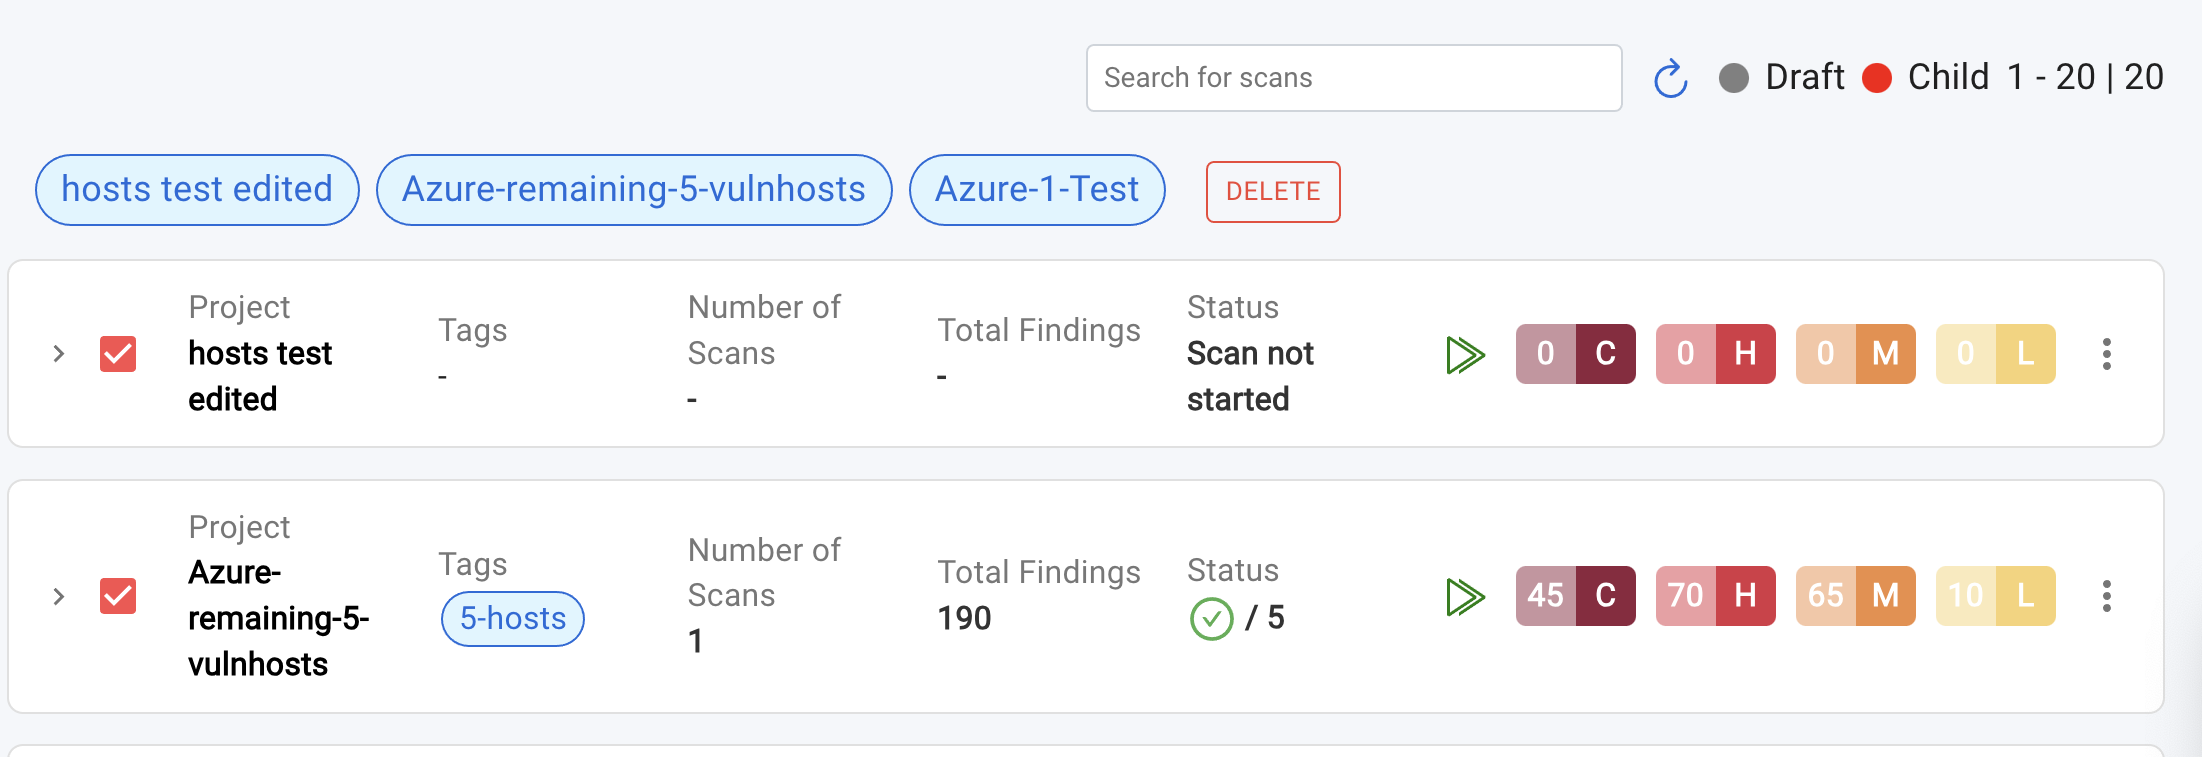
- To delete multiple scans at once, select the desired scans by checking their corresponding checkboxes, then click the "Delete" button.
To view a reference image of deleting multiple scans, click here to expand.
- To confirm deletion, a popup will appear. Please type
DELETEin the provided field and click the "Delete" button. This will permanently remove the scan.
Scanning multiple IP's and scan limits
- A single scan is limited to a maximum of 50 IP addresses. When importing resources, you can select up to 50 IPs for a scan.
- If your cloud environment has more than 50 IP addresses and you select the
"Select all Existing Virtual Machines for Scanning"checkbox, the scan will be automatically split into multiple smaller scans, known as child scans. These child scans will group 50 IP addresses together and submit them for scanning.
To view a reference image of Scanning all virtual machines, click here to expand.
- Parent scans do not contain any IP addresses; they serve as a container for the child scans.
- Child scans do not have an
Editoption. They inherit all scan settings and options from their parent scan.
To view a reference image of Parent and its child scans, click here to expand.
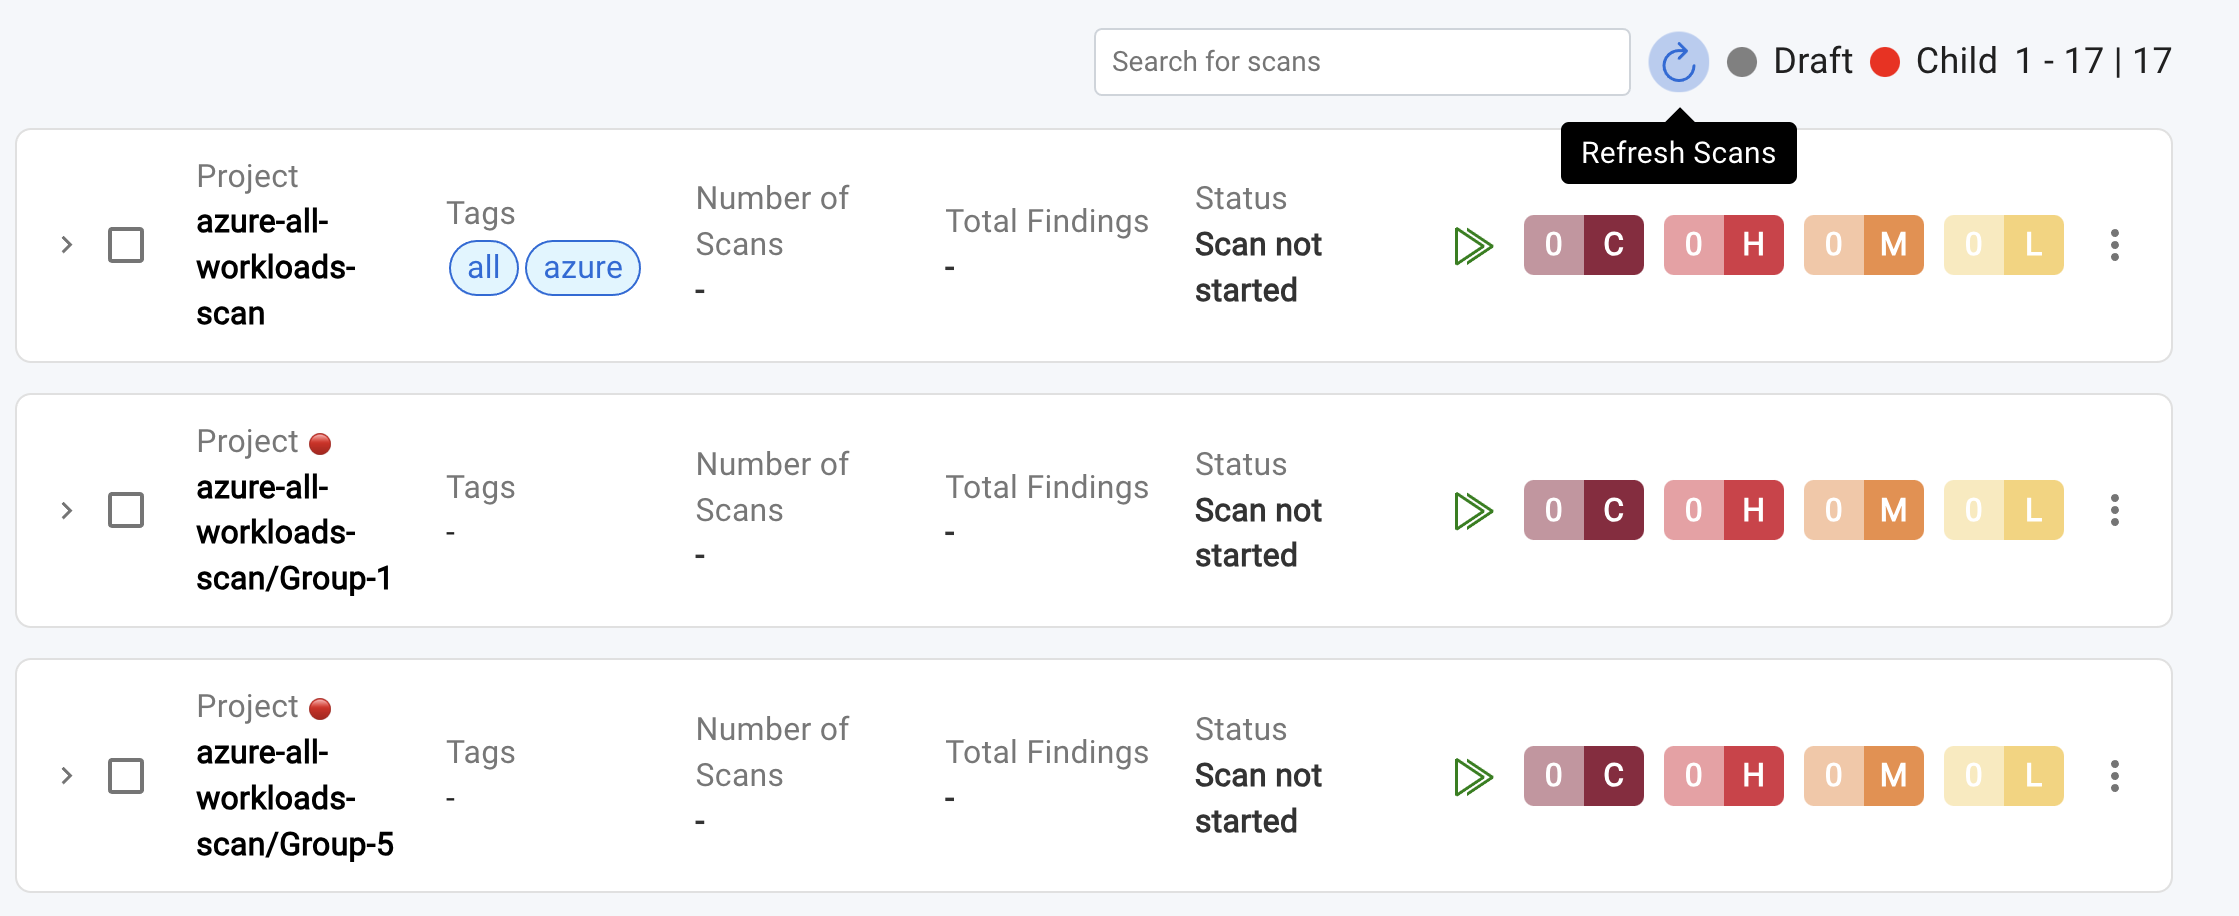
- Child scans are easily identifiable by a red circular badge next to the scan name. Additionally, the scan name will follow this format:
<SCAN NAME>/Group-{x}, where{x}represents the group number (e.g.,azure-workloads-scan/Group-4). - The parent scan name can be identified by removing the
/Group-{x}suffix from the child scan name. For example, if the child scan name isazure-workloads-scan/Group-4, the parent scan name isazure-workloads-scan.
Important Note:
Currently, our scanning feature supports up to 300 IP addresses. Scans within this limit can be automatically scheduled for continuous scanning.
If you need to scan more than 300 IP addresses, please submit a request to the TraQez Team to increase your scanning quota.
This limit is in place to prevent abuse and misuse of our platform for scanning external internet targets.
If you have more than 300 IP addresses, only the first 300 IP addresses will be selected for scanning.
Launching a Scan
- You can schedule scans to run at a future date or recur periodically, based on your configured scan settings.
- You can initiate on-spot vulnerability scanning, a real-time audit of workloads, by clicking the "Run" icon located within the accordion.
To view a reference image of Run Icon, click here to expand.
- Clicking the "Run" button on a Parent Scan triggers automatic scanning of all associated child scans, covering up to 300 IP addresses. Alternatively, you can scan a specific set of IP addresses from a child scan by clicking its corresponding "Run" icon.
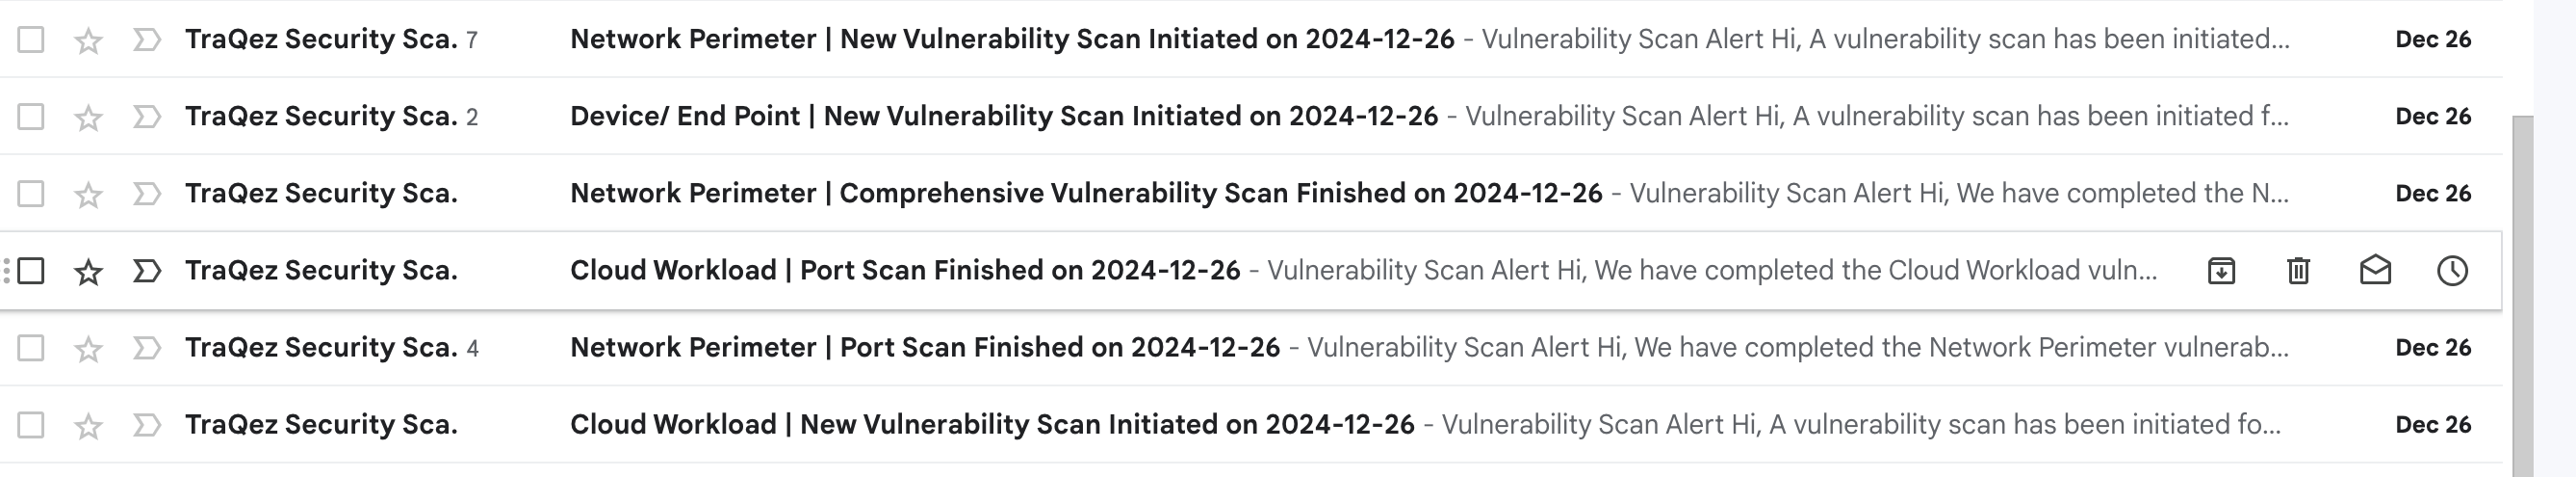
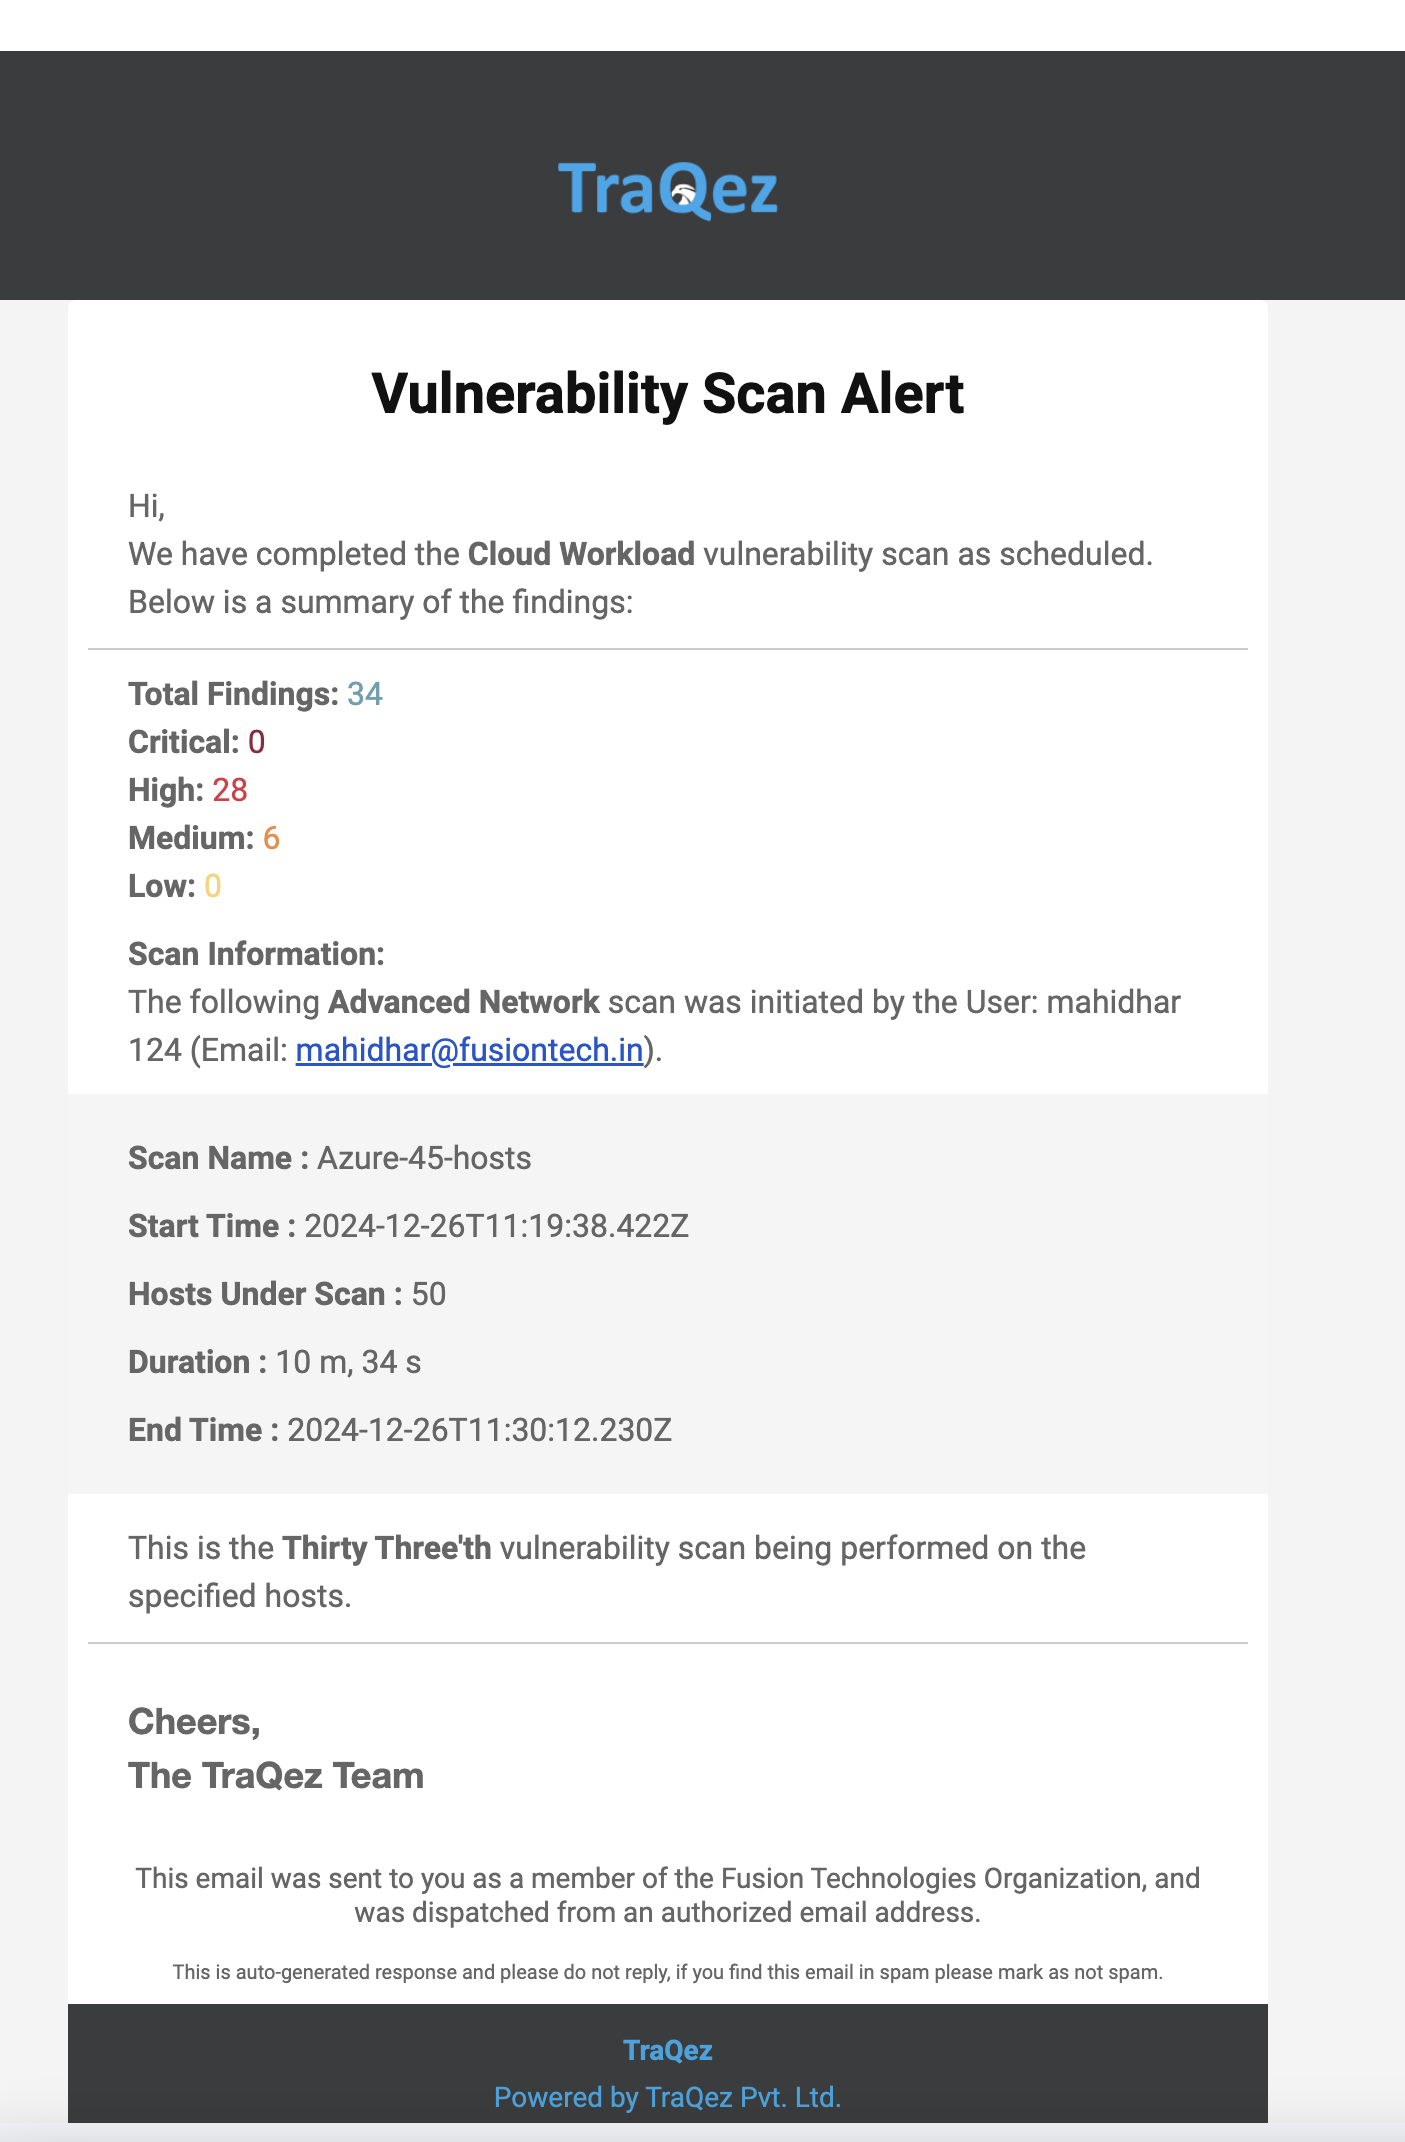
Email Notifications
Email notifications will be sent under the following conditions:
- When a scan is completed: A summary of findings will be emailed, provided email notifications are configured.
- When a scan is about to start: A notification email will be sent for every scheduled scan.
To view a reference image of Sample email notifications, click here to expand.
Troubleshooting Scan Errors
- When the scan fails, we will have 2 possible scan status. One is
Scan Submit Errorand another isFailed.
To view a reference image of scan status, click here to expand.
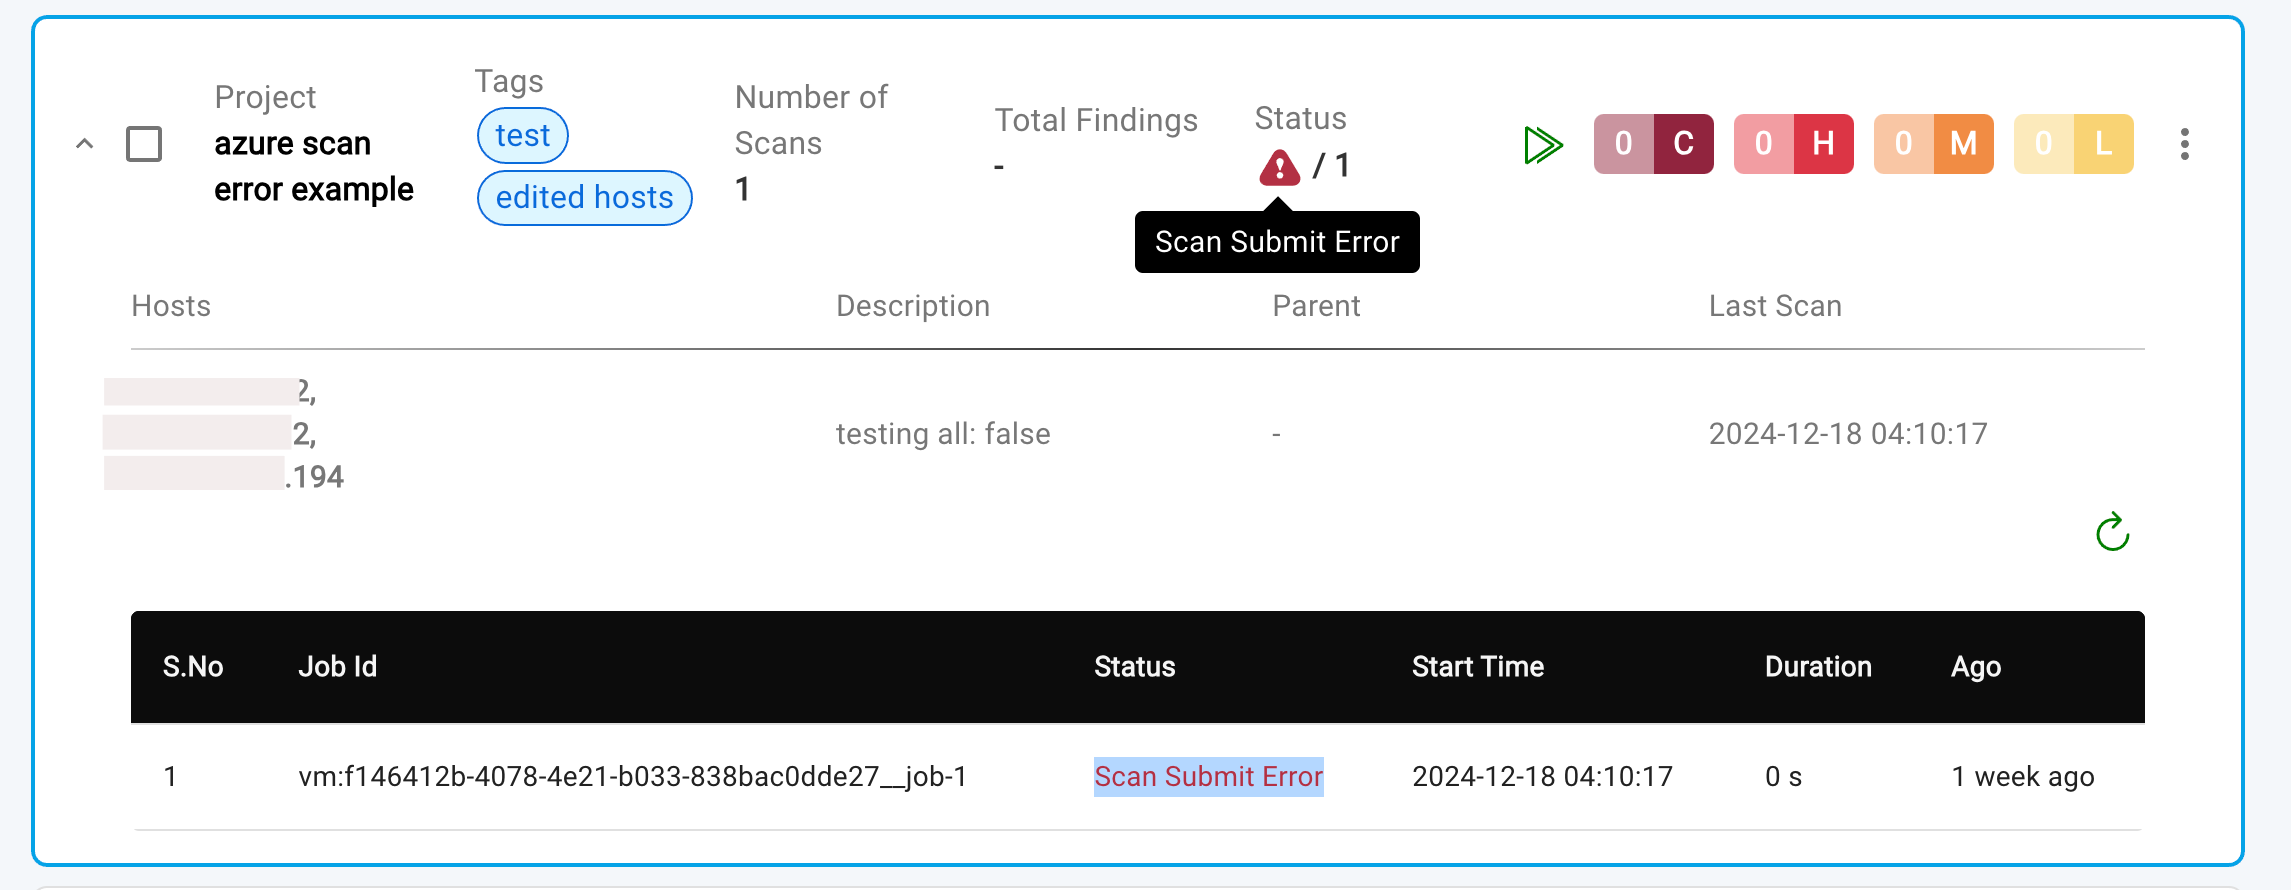
Scan Submit Erroroccurs when- The scanner API service for vulnerability scanning is temporarily unavailable due to maintenance.
- Network connectivity issues prevent scan submission.
- The IP scanning quota is exceeded (rate limit reached).
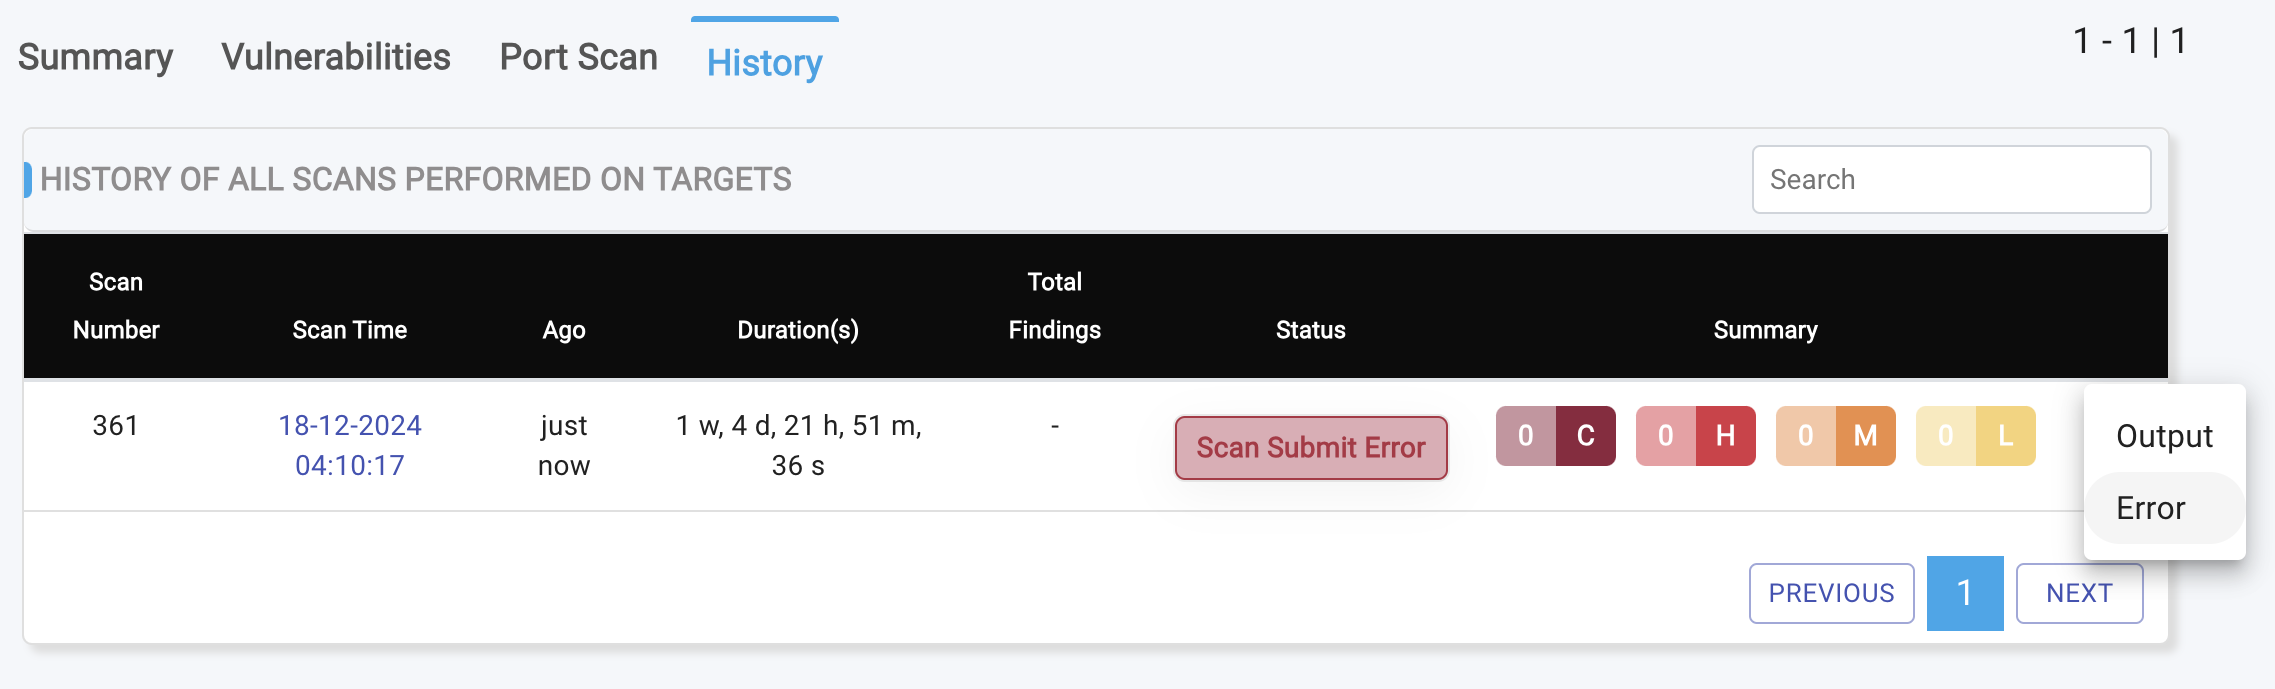
- To diagnose the exact cause of the error:
- Click on the scan name.
- Navigate to the
Historysection. - Click the three vertical dots in the menu bar.
- Select
Errorsfrom the dropdown menu.
To view a reference image of Errors in History tab, click here to expand.
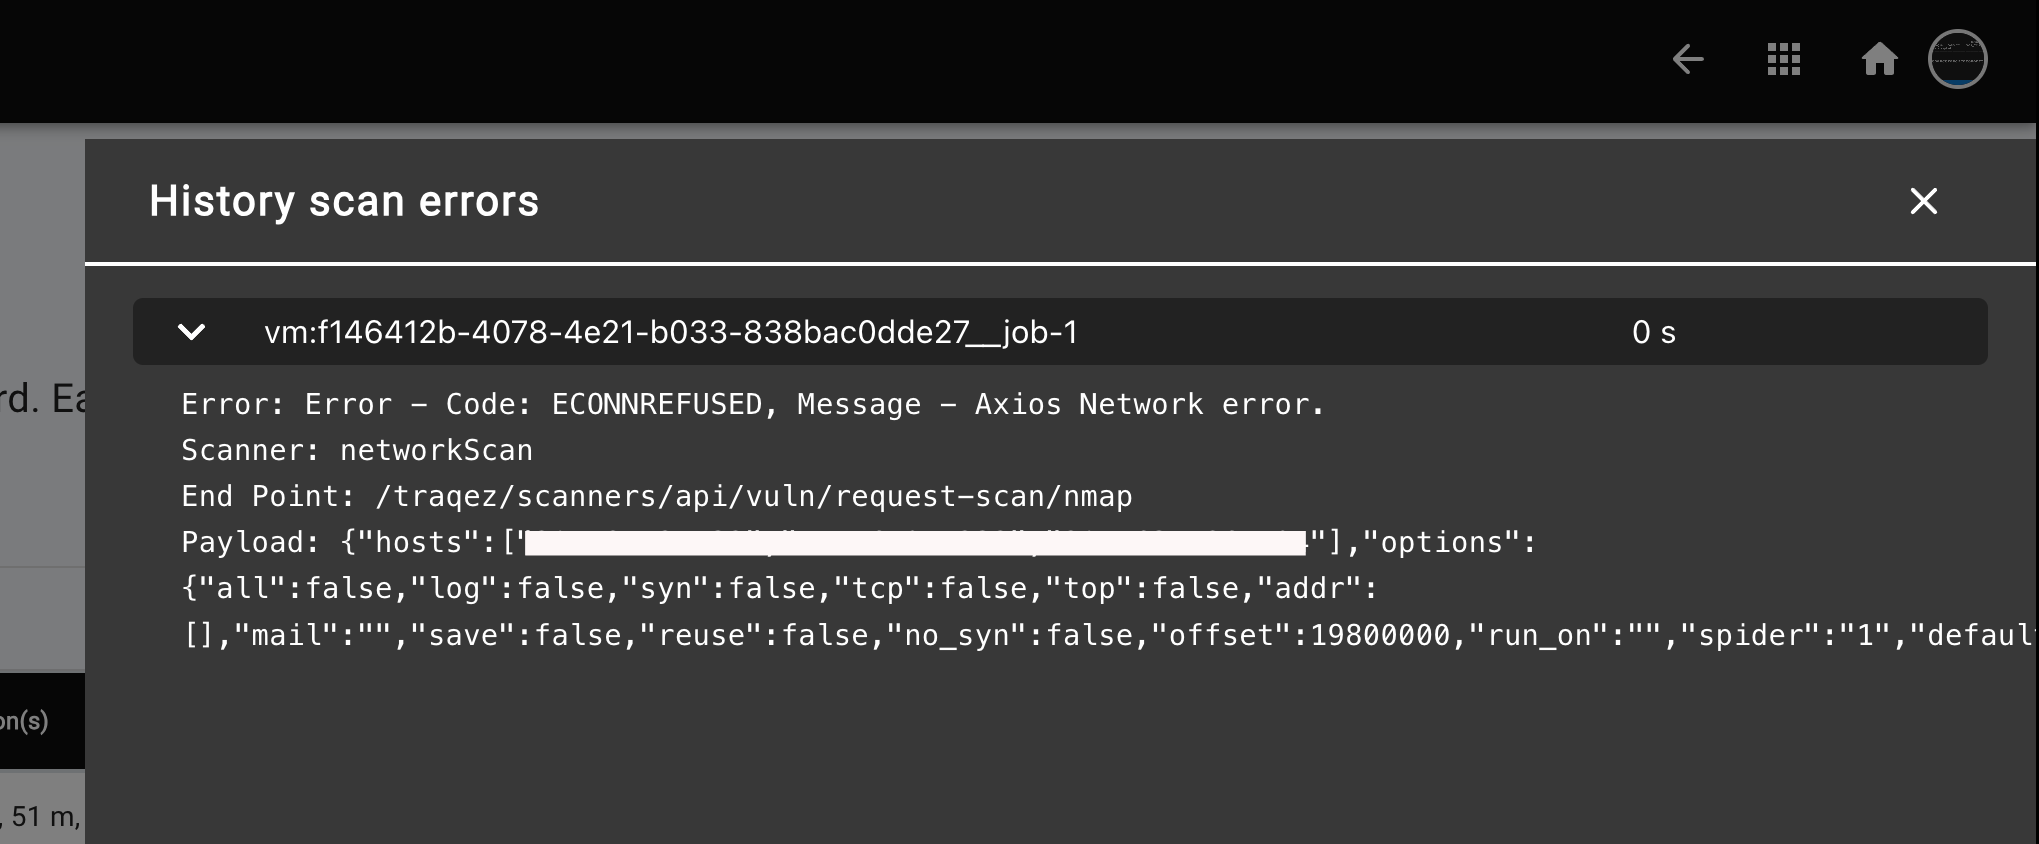
- A slide-out panel will appear, providing detailed error information. Please share these error details with the TraQez support team, and we'll be happy to assist you in resolving the issue.
To view a reference image of detailed error report, click here to expand.
- If no errors are detected, the error panel will display
No Data Available. - A
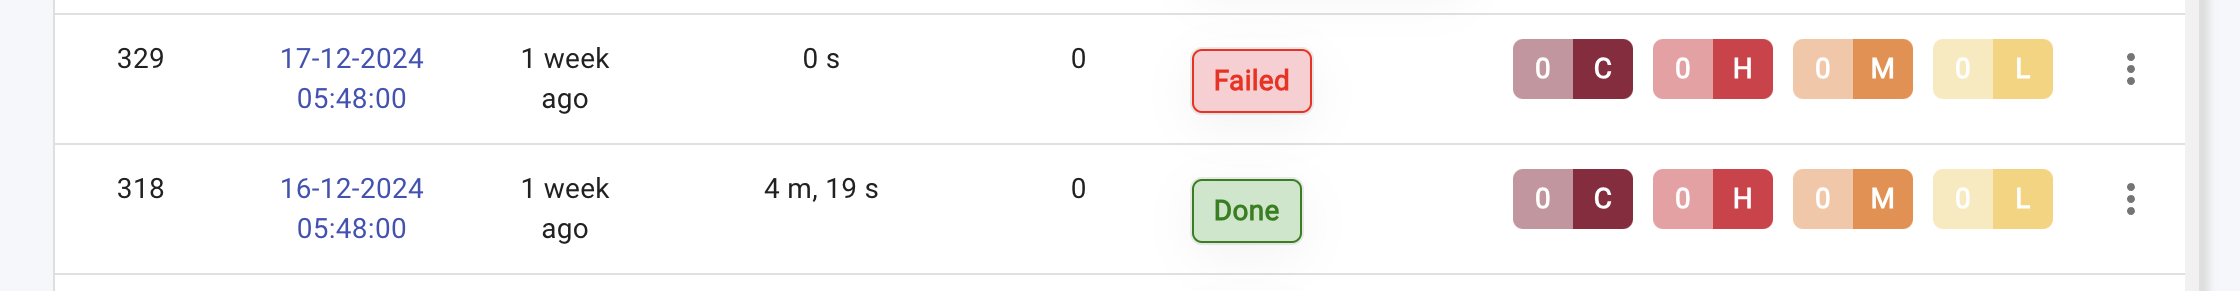
Failedscan status occurs when the scanner is unable to scan a target.
To view a reference image of Failed Scan, click here to expand.
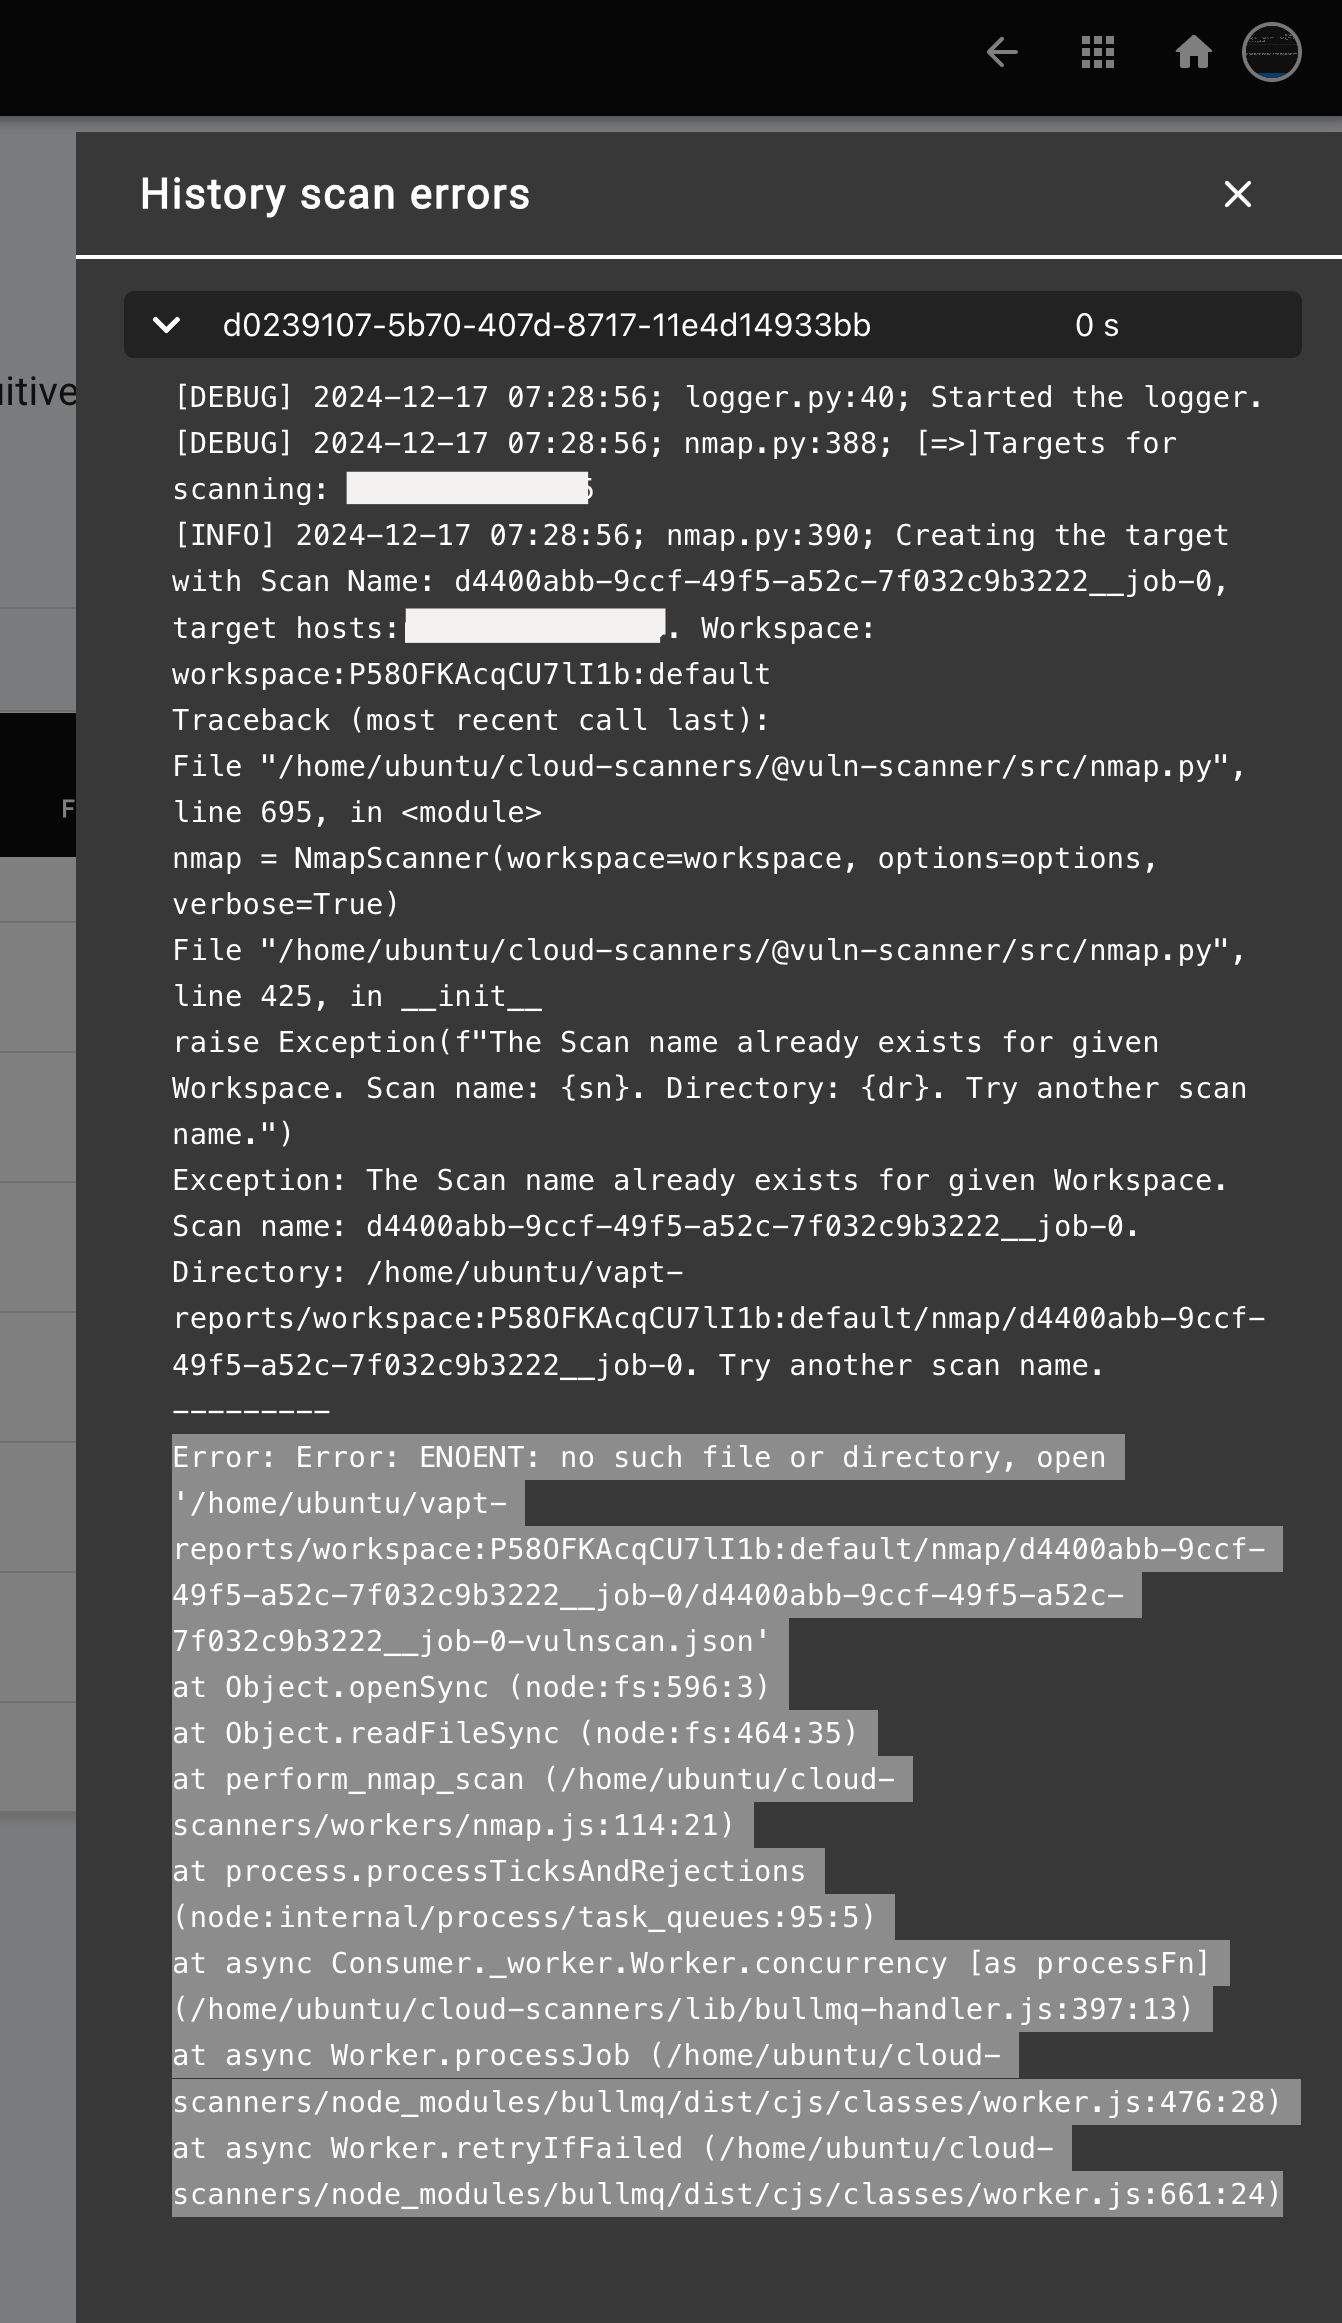
- In such cases, the Error report will contain specific error messages prefixed with
Error:, providing detailed information about the failure.
Error: Error: ENOENT: no such file or directory, open '/home/ubuntu/vapt-reports/workspace:P58OFKAcqCU7lI1b:default/nmap/d4400abb-9ccf-49f5-a52c-7f032c9b3222__job-0/d4400abb-9ccf-49f5-a52c-7f032c9b3222__job-0-vulnscan.json'
at Object.openSync (node:fs:596:3)
at Object.readFileSync (node:fs:464:35)
at perform_nmap_scan (/home/ubuntu/cloud-scanners/workers/nmap.js:114:21)
at process.processTicksAndRejections (node:internal/process/task_queues:95:5)
at async Consumer._worker.Worker.concurrency [as processFn] (/home/ubuntu/cloud-scanners/lib/bullmq-handler.js:397:13)
at async Worker.processJob (/home/ubuntu/cloud-scanners/node_modules/bullmq/dist/cjs/classes/worker.js:476:28)
at async Worker.retryIfFailed (/home/ubuntu/cloud-scanners/node_modules/bullmq/dist/cjs/classes/worker.js:661:24)
- Although rare, if a scan fails and displays a
Failedstatus, a detailed stack trace will be available in the Errors report. Please share this information with the TraQez support team, and we'll assist you in resolving the issue.
To view a reference image of Errors due to scanning a target, click here to expand.